

We have a saying here at Digital Logic, “If we can’t track it, we don’t buy it.” If you build the best website but have no idea how many visitors are coming to your website, which pages they’re visiting and for how long, and what pages led them there, chances are, you’re probably wasting a lot of time and money. It’s imperative that you know the answers to these questions and more if you want to get the best return on your investment.
This is where Google Analytics comes into play. If the Google Analytics tool is set up correctly, it can give you a clear insight into your website traffic, thus giving you a better understanding of your customers.
Why Do I Need Google Analytics?
Table of Contents
Toggle
Google Analytics is a web analytics tool provided by Google. This program gives you the ability to measure your website traffic and gather important information about your website visitors.
In order to set forth a plan to better your business, you must first know what works and what doesn’t work.
Google Analytics works to ensure users know exactly what steps need to be taken in order to optimize your website and provide your visitors with the information they need using the most popular of search engines, Google, of course.
Google Analytics gives you a clear picture of what you need to change in order to improve your site structure and maximize your conversions.
The program is completely free to use, and because of the information it is able to provide you about your website, you can be assured that Google Analytics should be able to help every online marketing campaign you’re running through your website.
When you begin the process of implementing Google Analytics into your marketing strategy, the process may seem a bit overwhelming at first. That’s why we’ve put together this guide to walk you through the process
Once you’ve finished this blog and have gotten the hang of how to use Google Analytics, you’ll see that this will quickly become one of your most useful tools in maximizing your website’s performance.
How to Set Up a Google Analytics Account
Before you’re able to start with Google Analytics, you’ll first need to create a Google account. You must have a Google account to access Google Analytics. You can either create a Google account or use a pre-existing Google account, but it needs to be an account that you, and only you, have access to.
Once you’ve got a Google account, you can go to Google Analytics to set up a new account.
Click on the Analytics tab, and you’ll be sent to another page in order to complete the setup process.
Here, you’ll click the blue “Sign Up For Free” button. Once you’ve clicked the button, you’ll be provided with the steps you need to take in order to finish setting up your Google Analytics account.
From here, you’ll click on the “Sign Up” button. Google Analytics will then ask you to fill out the required information regarding your Google account.
Sign Up for Google Analytics
Take your time when signing up for Google Analytics. You’ll need to enter in your new account information about your site in the correct boxes.
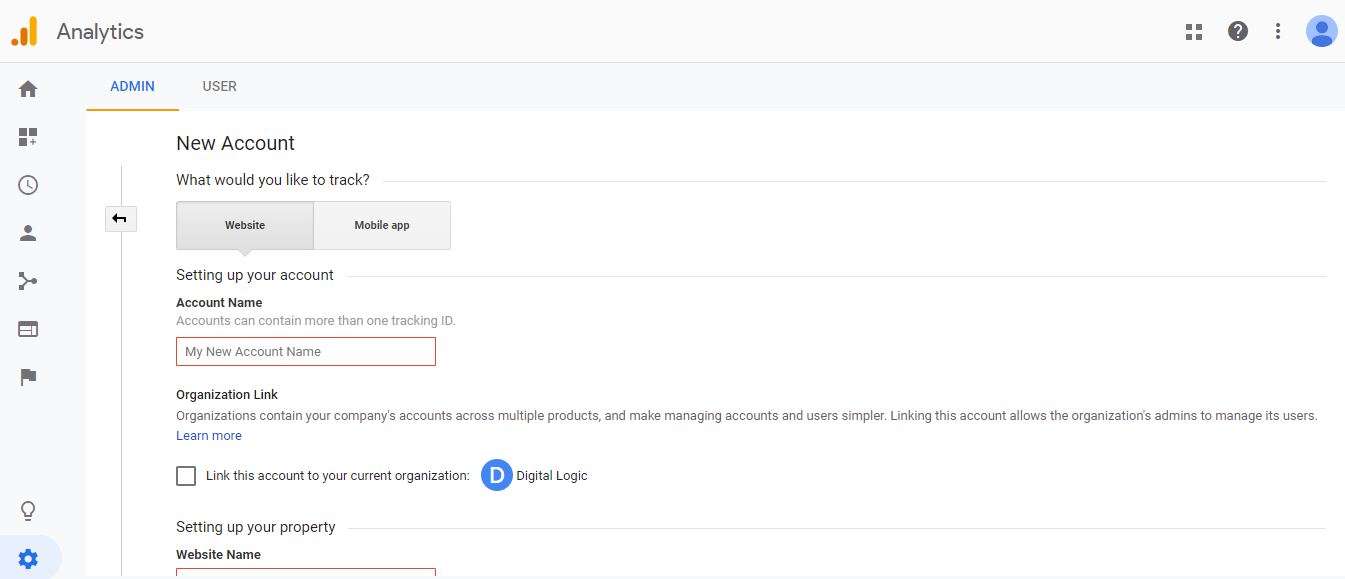
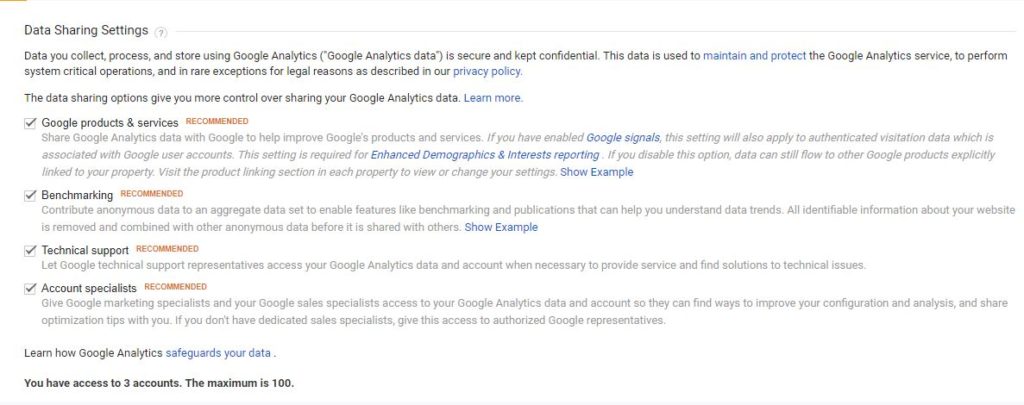
After you’ve entered this information, you’ll need to configure your data-sharing settings. The options for this are found right below. This determines the way that the program collects data from your site.
After this, you’ll click on the blue button that says “Get Tracking ID.” From here, you’ll need to read the Google Analytics terms and conditions that will pop up and agree (only if you agree, obviously).
Add a Google Analytics Tracking Code to Any Website
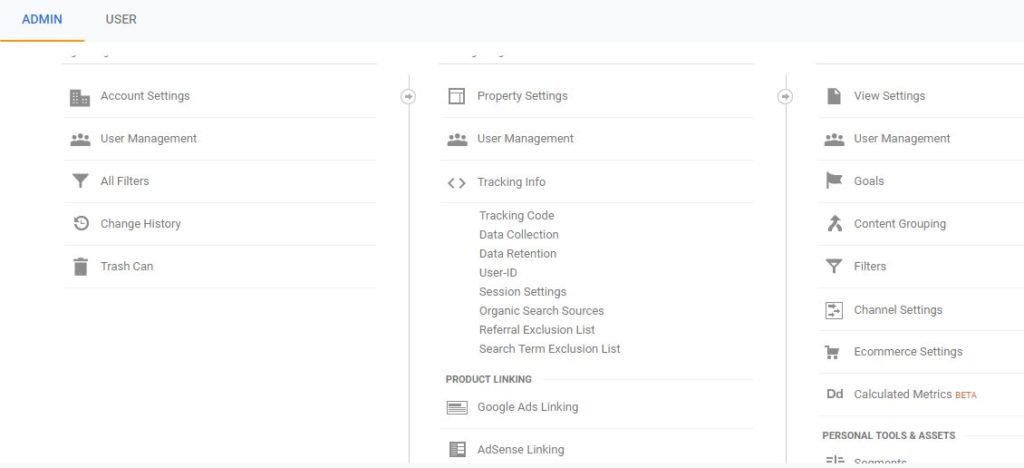
Once you’ve agreed to Google Analytics terms and conditions, you’ll be directed to the next page, where you’ll click on the “Admin” tab. From here, you’ll go to the “Account” column and choose the account you want to work with from the drop-down menu.
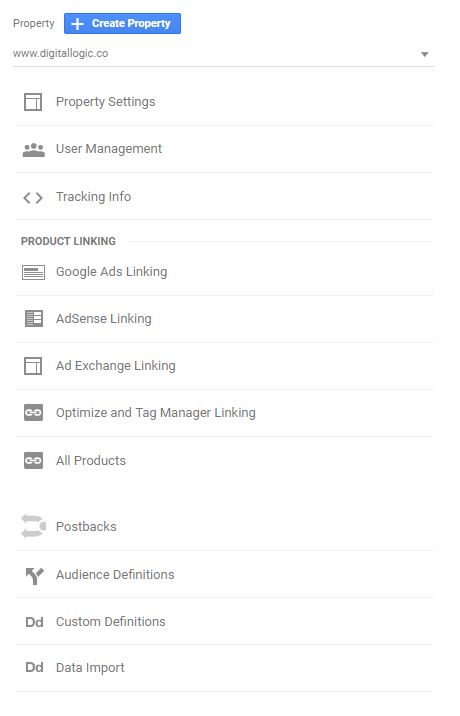
Afterward, go to the “Property” column and choose a property from that drop-down menu. Then, go to “Tracking Info.” A pop-up menu will appear, and you’ll select the button for tracking the code.
The conversion tracking ID needs to be installed on every individual page on your website that you want to track. This tracking setup is what provides Google Analytics with the information it needs to be able to accurately measure and report the activity on your website.
Most marketers prefer to install Analytics using Google Tag Manager. However, how you’ll actually install the code varies, depending on what type of website you have and what CMS platform your business is using.
If your business has a WordPress website, you can use a plugin called MonsterInsights. This plugin allows you to use the tracking setup on any page you want.
If your website is built with basic HTML, you can add your event tracking ID to the source code of every website page using Analytics and Google Tag Manager.
For this, you’ll have to use an HTML editor or another text editing program. Two popular text editing programs include Notepad for Windows and TextEdit for Mac. You’ll want to install your tracking code by adding it before the </head> tag on all of the pages you want to track.
After you’ve edited your code within the text editing program, you will then need to upload the newly coded files to your website’s “Pages” via a File Transfer Protocol program. Two popular FTPs (File Transfer Programs) are SmartFTP and FileZilla. You’ll still need to know basic HTML in order to use an FTP.
Adding a Google Analytics Tracking Code to a WordPress Website
Your Google Analytics code may be installed on your WordPress website by one of two methods:
Adding a Google Analytics Tracking Code Manually
In order to complete the following setup, you will need to have a basic knowledge of how WordPress uses templates to manage content. (Google Tag Manager can help speed this process up dramatically)
Once you’ve copied the tracking code that was supplied to you from Google Analytics, you’ll need to log into your website. This can be done by searching your exact website URL and adding “/wp-admin” to the end of the URL.
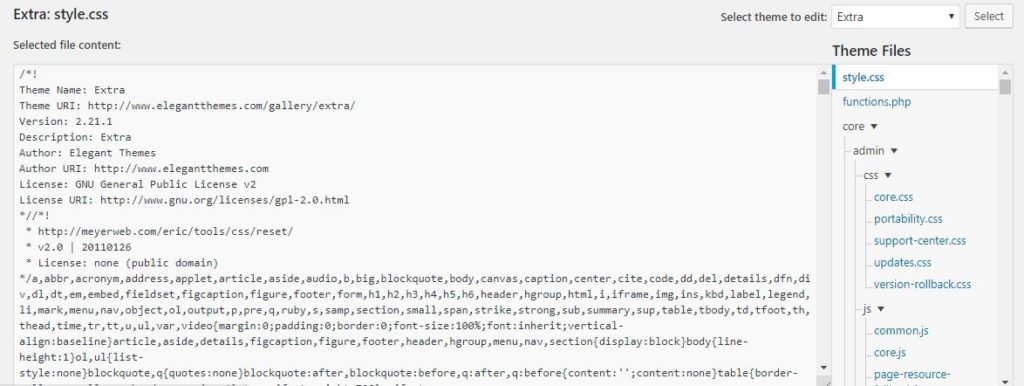
Once you key in your username and password, you’ll want to go to the Dashboard, if it doesn’t automatically appear. On the dashboard, you’ll select the “Appearance” tab on the left-hand side of the screen. A pop-out will appear, and you’ll select “Editor.”
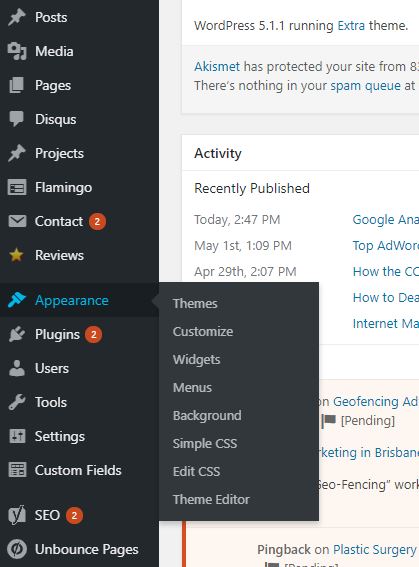
Once you’ve opened the “Editor” page (otherwise known as “edit themes”), You will need to look at the “Templates” section, located on the right-hand side of the screen, for a file named “header.php.” If you can’t locate it quickly, you can also press “CTRL + F” and search for the file name under the “find” popup. When you locate the file, click on it.
From here, the theme editor will open the file and allow you to edit it from this screen. You need to find the HTML head tag or “</head>.” You can locate this quickly using the “find function” with CTRL + F, as we mentioned earlier.
Once you find this section, click in front of it. Press Enter. Then, paste the tracking code in the blank space you’ve just created.
This will be a little different if you’re using the new Google Tag Manager.
After you’ve pasted the code, click on the “Update File” button. This is located just under the file area you were just editing.
You always want to check your work using Google Tag Manager.
In order to do this, you have to head back to the other tab where Google Analytics is opened.
You may want to wait a minute or two. Refresh the page to see if Google Analytics did correctly collect data.
If you’re still not seeing any data, especially after a few minutes, you can force-test the data by clicking the “Send Test Traffic” button.
You’ll want to re-test this again in 24 hours in order to see the reports of actual traffic data. For this, you’ll go into the Reporting tab in Google Analytics.
Adding a Google Analytics Tracking Code Using a WordPress Plugin
You can add Google Analytics and Google Tag Manager to your WordPress website by installing the MonsterInsights plugin. The plugin is easy to configure, and it allows you to immediately start tracking your website’s traffic immediately after you’ve configured it.
First, you’ll need to log into your website. This can be done by searching your exact website URL and adding “/wp-admin” to the end of the URL. Once you key in your username and password, you’ll want to go to the Dashboard if it doesn’t automatically show up. On the dashboard menu, you’ll select “Plugins” on the left-hand side menu. A pop-out will appear, and you’ll select “Add New.”
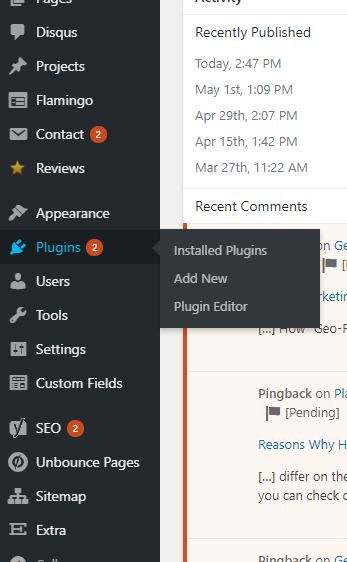
You’ll see a search bar located in the upper right-hand corner. Here, you’ll type in Google Analytics for WordPress by MonsterInsight. Click the “Install Now” button. Then, click the “Activate” button.
Now is the time to configure the plugin you’ve just installed and activated. To do this, you’ll go back to the menu on the left-hand side and select “Insights.” On the pop-out, you’ll select “Settings.”
This opens the plugin settings page.
Now, you must connect your Google Tag Manager and Google Analytics account with the MonsterInsights plugin. You can do this automatically by authenticating it with your Google account, or you can do this manually by entering the user account code.
Analytics Authentication
Automatic Authentication
For automatic authentication of your Google Tag Manager and Analytics accounts, you’ll sign into your Google Analytics account and click “Authenticate With Your Google Account.” You’ll go through the setup steps you are prompted through. This is the recommended setup because this way allows you to use the dashboard and the reports features of the plugin.
If you use automatic authentication, you should be able to access the MonsterInsights Dashboard through your WordPress Administration Dashboard panel to view all of the data that the plugin pulls from the Google Analytics interface.
Manual Authentication
To enter your user code manually, click on the “Click here to authenticate manually” button on the Plugin Settings page.
Now, go to your Google Analytics interface and look for the Tracking Code under Property, then Tracking Info. You’ll copy the entire code, including your UA. This is located under the Tracking ID tag.
From here, you’ll need to go back to the tab where you have your plugin settings opened and paste the code. Click the “Save Changes” button. You must wait at least 12 to 24 hours before you’ll be able to view the website tracking information.
Any time you want to view your data, you’ll check it on your Google Analytics interface or using a Google Tag Manager extension.
Learning about your Website Audience
Congratulations! You’ve done most of the tedious and difficult maneuvering if you’ve made it this far. As we said before, it usually takes a little bit of time before you’ll be able to get a clear image of what your website audience is doing. In the meantime, you can start learning about how to actually use Google Analytics to process the information that will be given to you.
Google Analytics Site Search
Site Search shows you if your audience is taking advantage of your website’s search bar option, which terms your audience is searching for, how often these terms are searched for, and how effective your website is at returning results for the searches entered.
This has to be set up for each reporting view that you want to have data access to. A reporting view, or “view” for short, is basically a subset of a Google Analytics account property that has its own unique configuration settings. Google Analytics gives you the ability to create multiple views for each property and configure how each view will show different subsets and collect data sets for the property.
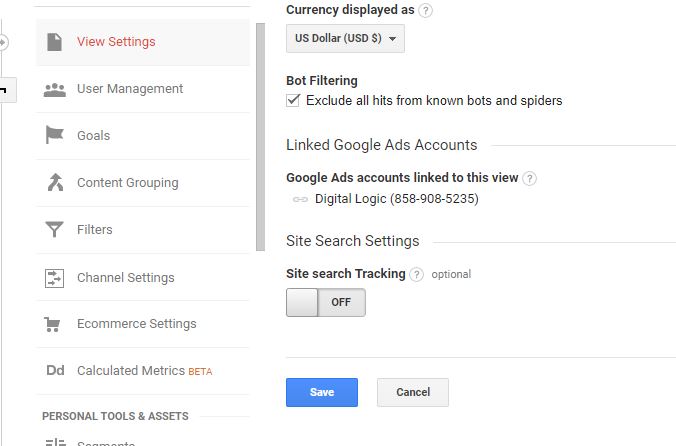
To do this, you’ll first need to log in to your Google Analytics account and click on the Admin Tab. On this tab, you’ll see three different options: Account, Property, and View. Go to the “View” column and select View Settings.
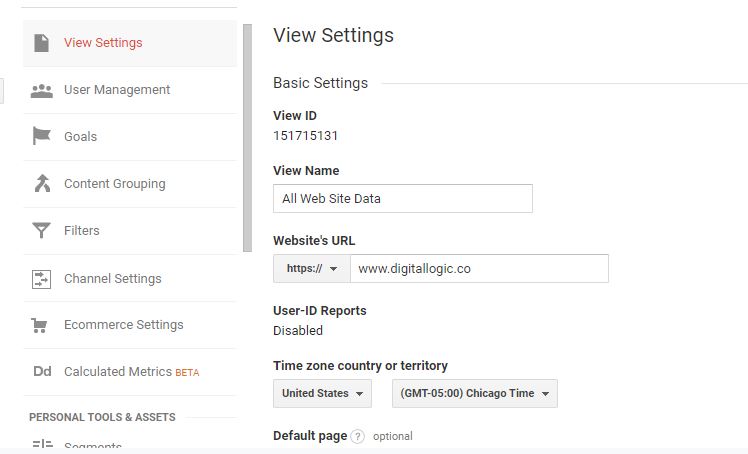
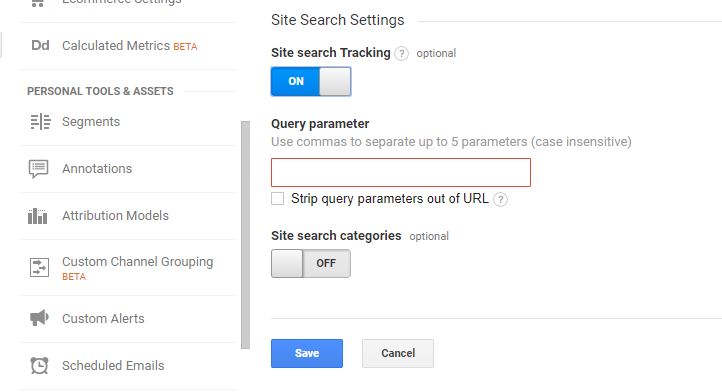
Here, you will see the website Search Settings, and you’ll set the tracking to “On.”
After this step is completed, you’ll be provided with the Query Parameter box. This is where you’ll enter your website’s search query parameters.
Typically, the query parameter is “s” or “q.” You can check your website by running a search on your website. It doesn’t really matter what you search for. Once you do, you’ll see the query parameter in the URL placed right before your search.
For example, if you searched “Digital Logic” on your search bar, the URL would look like this:
https://google.com/?hl=en&q=digital_logic…
Because there is a “q” before the =digital_logic, we know that your query parameter is “q.”
After this, click the “Save” button, and your Google Analytics interface will be able to track every search that is made on your website.
Setting Up Your Website’s Goals
You’ll need to set up goals in order for Google Analytics to track the activity on your website using Google Tag Manager. Which goals you select will vary drastically based on your industry and what type of business you run.
For instance, if you have an e-commerce website, you should have already made a dedicated confirmation page that users are directed to after they’ve made a purchase. Or, if you use a CRM system and use the contact information form to generate leads, you should similarly have a “Thank You” page that your users are directed to after they finished filling out the form and thus have subscribed to your email list.
Why are both of these important?
Because when you set up certain goals, Google Analytics will track your conversions and provide you with the crucial information that will help you be able to determine how effective or ineffective your website.
You’ll configure specific actions as goals, and whenever your visitors take those actions, Google Analytics will record those as a conversion. This gives you a clear picture of what actions are taking place on your business’s website. With each action that takes place or doesn’t take place, you’ll be able to see what changes are working and which efforts are generating a return, and which ones aren’t. You’ll continue to tweak these until your website becomes a converting machine.
You can create up to twenty goals. Whenever a certain activity or “goal” is triggered, Google Analytics will measure what you’ve asked it to and provide you with a detailed Google Analytics report surrounding the action.
How to Set Up Your Google Analytics Goals
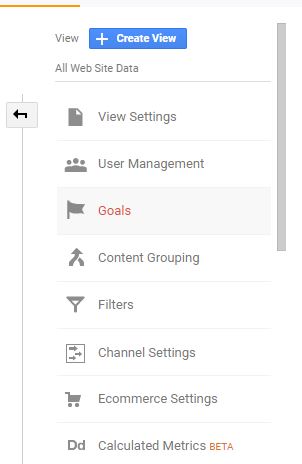
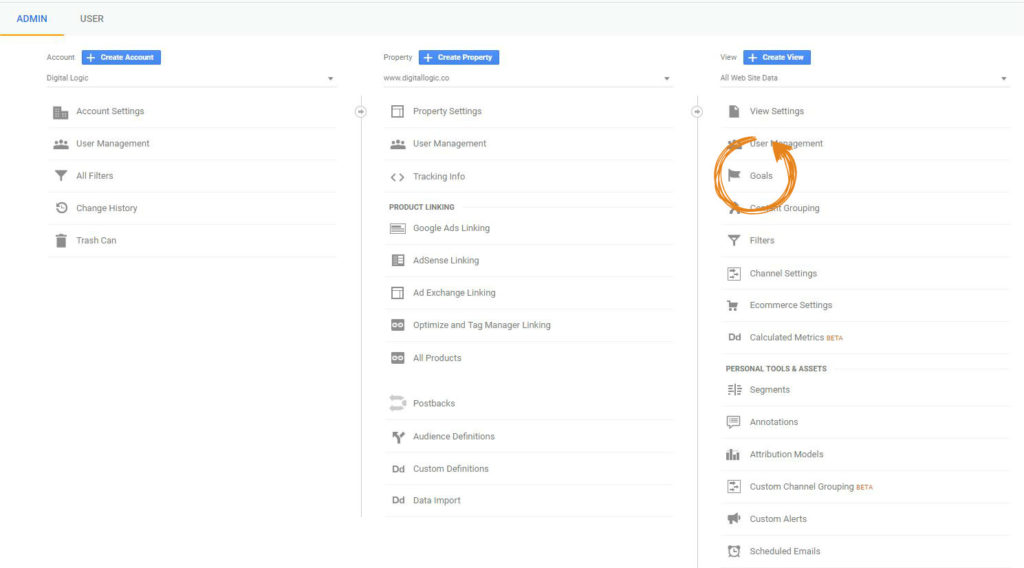
As usual, you’ll log in to your Google Analytics account. Then, click on the “Admin” tab located at the top of the page. From here, you’ll select the “View” column, and in the drop menu, select “Goals.”
Next, you’ll click the large red button that says, “+New Goal.”

After this, there are three steps you’ll have to take before you can create the goal.
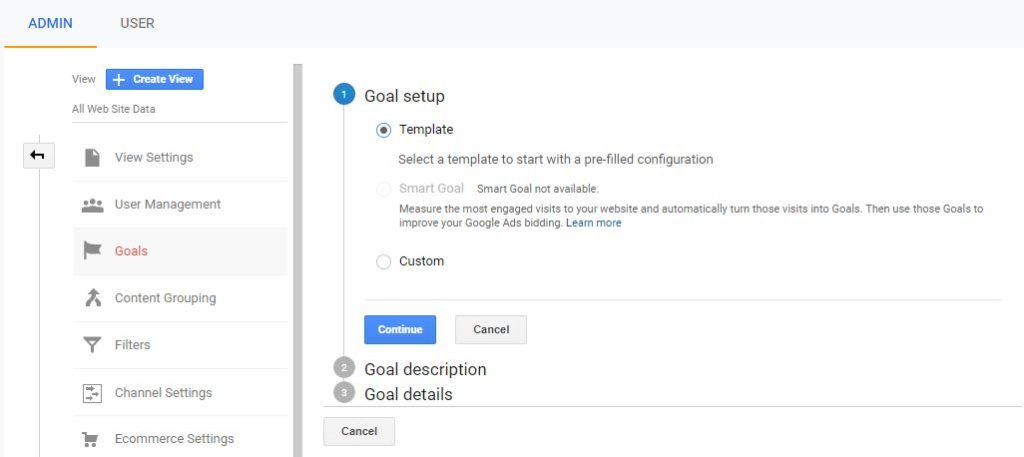
Google Analytics Goal Setup
There are three options for this step. These include using a template, creating custom goals, or creating Smart Goals.
The option you choose depends on what type of website you’re running and what types of goals you wish to set. You may want to read all three options before selecting one:
Google Analytics Goals Template
Under “Template,” you’ll find four different goal categories: revenue, acquisition, inquiry, and engagement. Goal templates are there to help you set goals that align with your business objectives. You can actually create a goal for each of the categories. This will help you learn a lot more about how your audience interacts with your website.
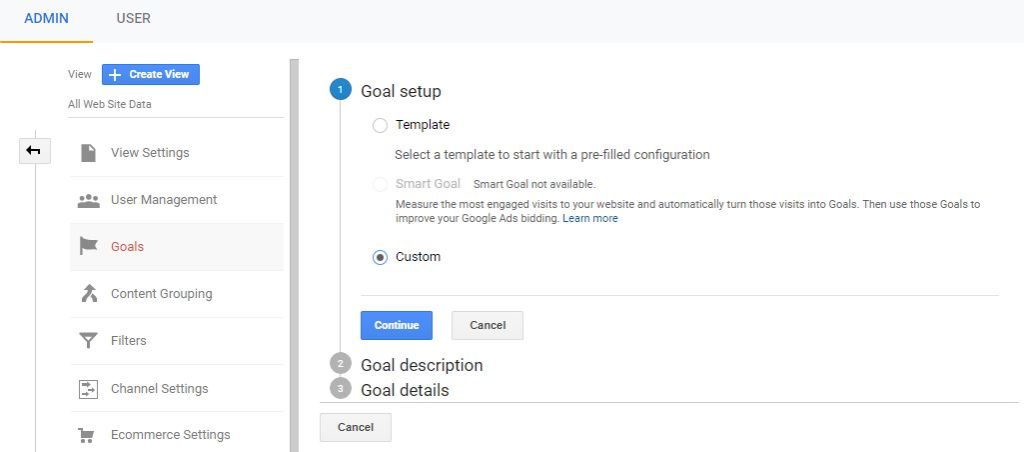
Google Analytics Goals Custom
If none of the objectives above really aligns with your business objectives and if the smart option doesn’t apply to your company either, then the custom option may be for you. If you want to choose this option, all you need to do is click “Next.”
Google Analytics Smart Goals Option
Smart Goals is the option set more for an AdWords integration. This allows AdWords advertisers to use the optimization tools set up in Google AdWords to track and increase their conversions. When you choose Smart Goals, Google Analytics will give each of your website visits a score. This will help you determine which visits are the most likely to lead to a conversion and, therefore, translate those visits into Smart Goals. If this option is applicable to your website, all you need to do is give your specific Smart Goal a name and continue to the next step.
Learn more about our AdWords management services.
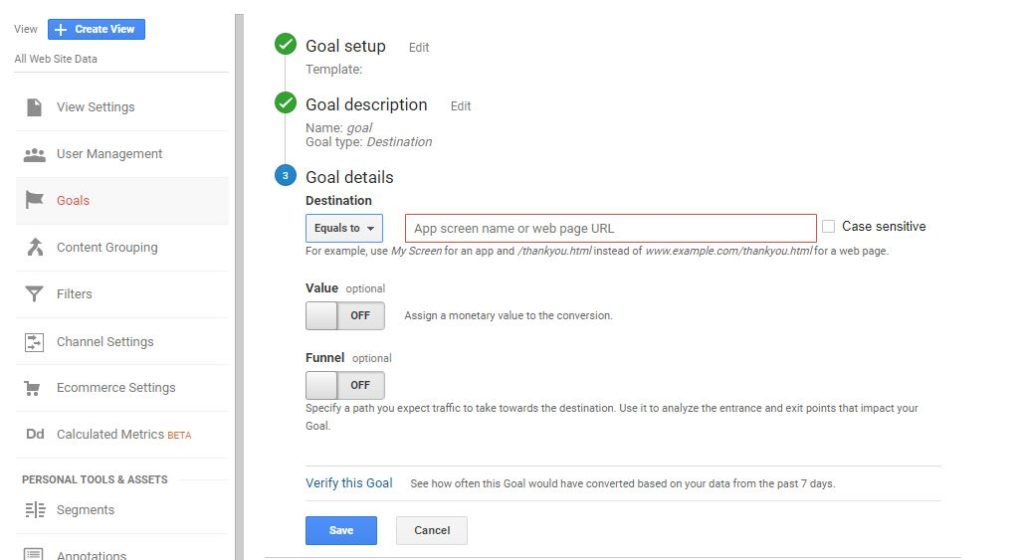
Google Analytics Goal Description
In this step, you’ll name your goal and choose your goal’s type. In Google Analytics, there are four types available: Destination, Duration, Pages/Screens Per Session, and Event data.
You’ll need to name each individual goal something intuitive. This way, you’ll be able to clearly understand every piece of information on your Google Analytics reports. You can change them later into your existing goals. So, for this reason, you’ll need to make sure their names are ones that you’ll remember, along with the exact data point for which you proposed them. This way, you won’t get confused when you inspect your reports.
Destination Goal Type
If you want your goal to measure the success of your subscriptions. You’ll want to treat your pageview as your conversions, select “Destination” as your goal type and then click the “Next” button.
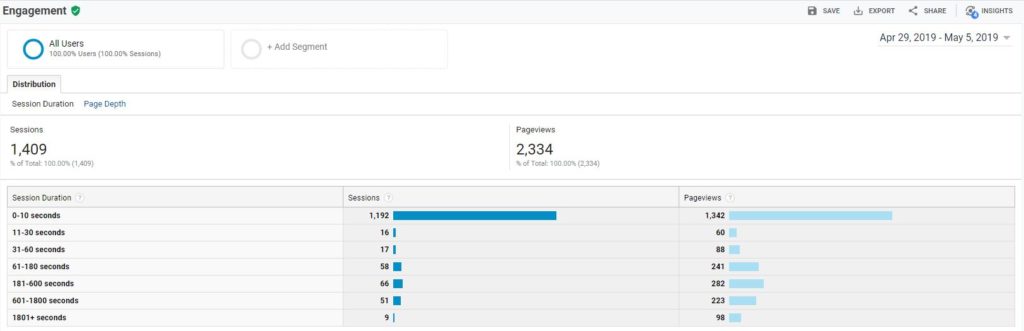
Duration Goal Type
You will choose duration as your goal type if you want to treat the time spent on a particular page as a goal. This will allow you to check the engagement of your visitors.
Pages/Screens Per Session Goal Type
If you want to treat the number of pages per session as a conversion goal, then this is the type you’ll select. When we say the word “screens,” we’re referring to mobile app screens. Google Analytics associates this with measuring the performance of a mobile app instead of a desktop website.
Events Goal Type
You will choose the events goal type if you want to treat the interactions of your visitors as a conversion. For example, if you want your visitors to watch a video after they’ve completed a step toward conversion, you’ll create that as an event goal to be measured.
You’ll need to specify the details of your event goal in the following steps. After you’ve selected your event type, click on the “Next Step” button in order for Google Analytics to pull the event data.
Google Analytics Goal Details
The following steps will vary based on which goal you’ve selected.
We’ll break it down by category:
Destination Goal Details
If you selected “Destination” as your goal type, you’ll need to enter your page URL or screen name in the specific field.
For example, if you want to measure the activity to end with a “Thank You For Your Purchase” page, you’ll want to enter something along the lines of “/Thank-You-Page” or “Thank-You.html” and select the desired match type from the menu that appears.
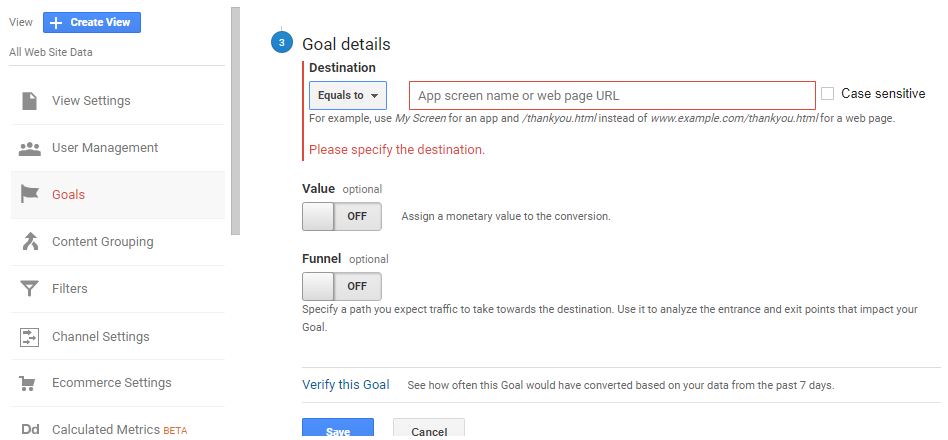
There are three match types here: “Equals To,” “Begins With,” and “Regular Expression.” Now, you can assign a monetary value to your conversions. This step is optional. This can help you compare your conversions and track the changes you’ve made to your website.
If you’ve chosen Smart Goals, you can’t assign a monetary value during this step. You can also specify a funnel for your goal. This shows the path that your visitors take in order to reach their destination. If you do choose to create a funnel, you’ll need to enter a page name for each step included.
Duration Goal Details
If you’ve selected “Duration” as your goal type, you will first need to specify the amount of time spent on particular pages that you want to track. From here, you’ll be provided with three fields: Hours, Minutes, and Seconds.
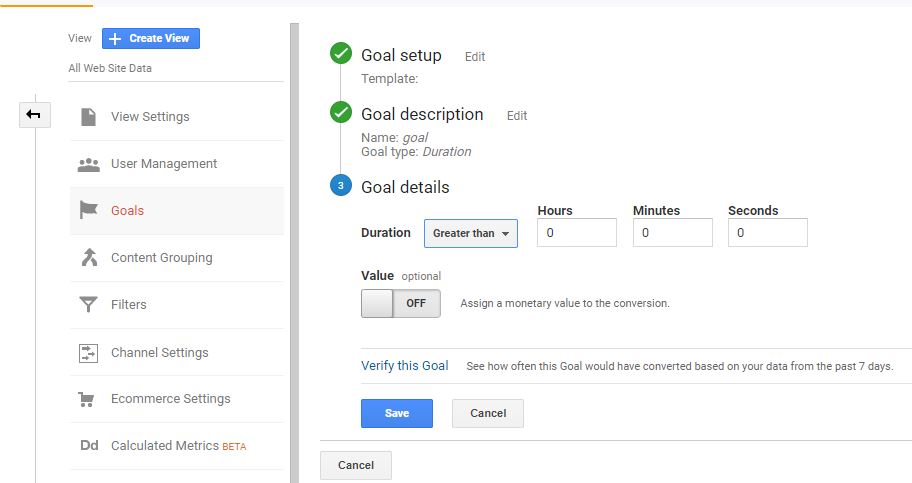
When your visitors spend more than the specified amount of time on your website, Google Analytics will count this as a conversion.
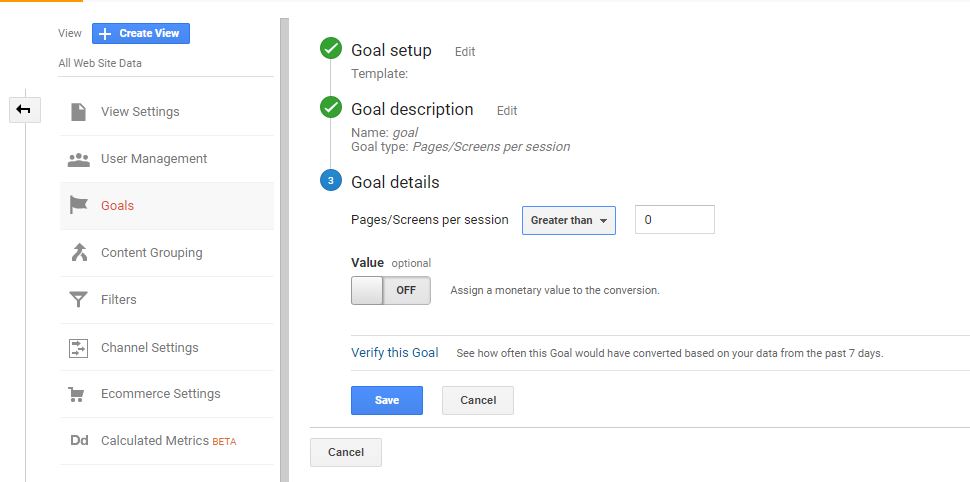
Pages/Screens Per Session Goal Details
If the goal type is Pages/Screens per session, you must input the number of pages that will justify a conversion. This means that Google Analytics will generate a conversion every time this time indicator is reached.
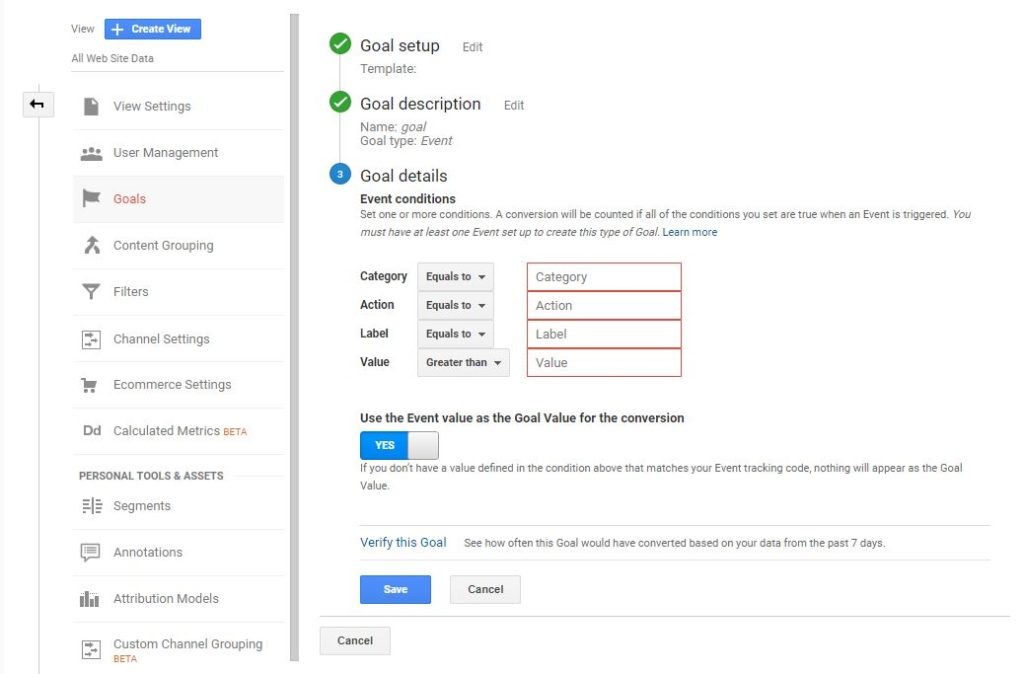
Event Goal Details
If you selected “Event” as your goal type, Google Analytics will provide you with the conditions. This gives you the ability to configure the components of every event. You can also create an event to measure the event data from your event goals.
After you’ve completed the step associated with your selected goal, you will click on the blue “Create Goal” button.
You have a hundred accounts limit on Google Analytics, so if you want to create another one, all you have to do is go to the “Admin” tab, click on the drop-down menu under the “Account” column and then select “Create New.”
You can also create a new property. This means that you can add another website under your existing account information. You can add up to fifty new websites under one account. This is done on the “Admin” tab under the “Property” column. You’ll select “Create New Property” from the drop-down menu.
How to Use Google Analytics
Once you have your Google Analytics dashboard set up and running, you will start getting several different reports. These are provided in order to help you improve your website. To a beginner, these reports will absolutely seem confusing. This is why we’ve included this section in our comprehensive guide.
By the end of the guide, you will have a better understanding of the information that your reports are providing you. You’ll be able to understand what some of the key KPI metrics are and should be able to easily find your way around the Google Analytics dashboard.
Google Analytics has four main tabs: Home, Reporting, Customization, and Admin. We’ve separated the information based on these four sections.
Google Analytics Home Tab
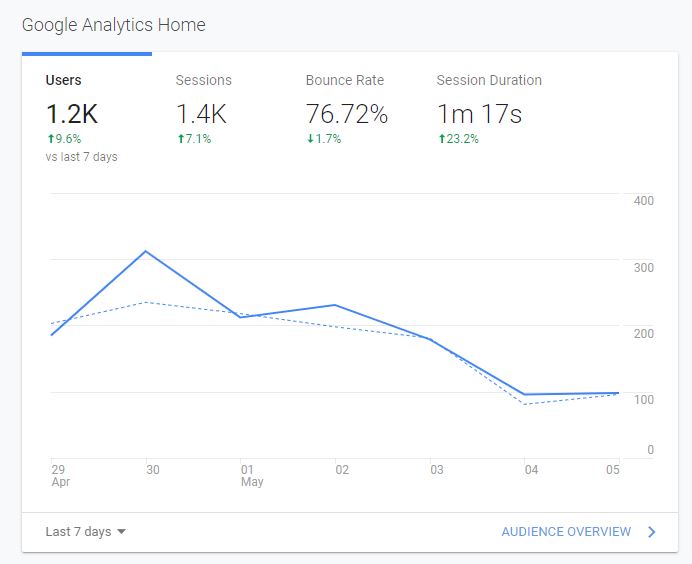
On the Google Analytics Home Tab, you’ll find the basic information about your account in a quick overview format. Website owners with more than one website under your account, you will be shown a list of all of the websites under that account information. You can easily select which site you want to view the reports on.
Also, on the Home Tab, you’ll be given information about the following:
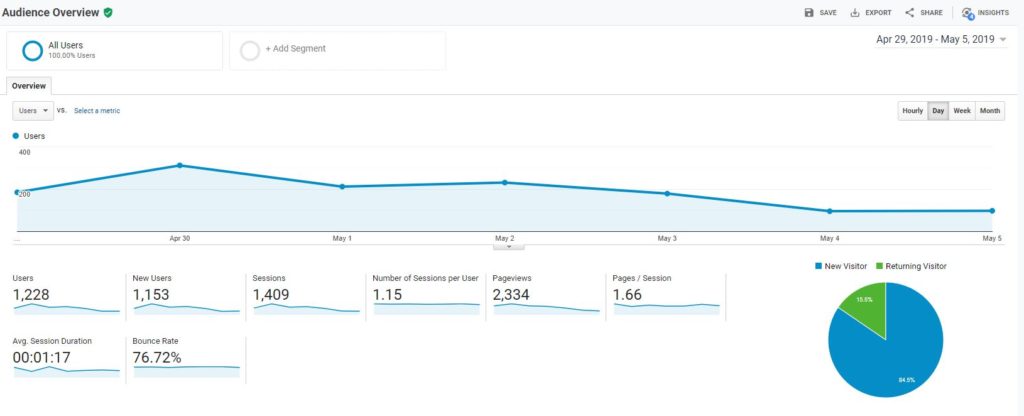
The Sessions column shows the total of all user interactions on your website occurring within the specified time frame.
The Average Session Duration column shows the average duration of every session that took place on your website within the specified time frame.
The Bounce Rate column shows the total percentage of viewers who have left your website before a specific time is reached. Think of them as “bouncing” from your website.
The Goal Conversion Rate column simply shows the sum of the overall conversion rates on your website.
Google Analytics Customization Tab
This tab allows you to create and track your custom reports specific to your own needs. You can create as many custom reports as you need, and you’ll always have access to them on the Customization tab.
Once you click on the “Customization” tab on the left-hand side of your screen, you’ll see the options for four different categories: Dashboards, Custom Reports, Saved Reports, and Custom Alerts.
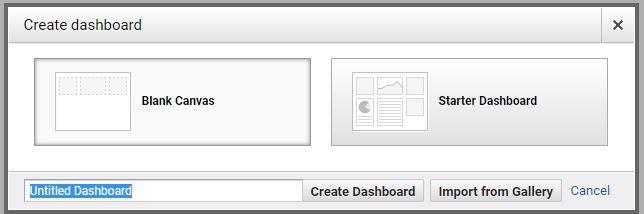
Dashboards Tab
When you select “Dashboards,” you’ll see an overview of the most important reports. You can create and customize your dashboards fairly easily, and you’re able to add as many widgets as you want. You select information that is important for your website and edit your dashboards to include this data. Every view in Google Analytics comes with a default dashboard, and while the default dashboard on Google Analytics works pretty well across the board, the usefulness of creating your own dashboard can definitely come in handy. Dashboards can contain up to twelve widgets each, giving you the ability to see the metrics that you care about the most.
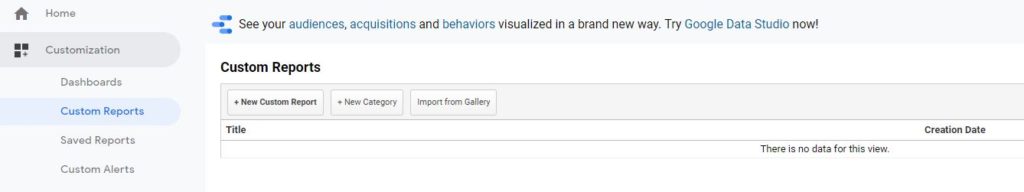
Custom Reports Tab
To create a custom report, you’ll first need to choose a metric that you want to track and at least have at least one dimension. So, you’ll want to track two separate cases, basically.
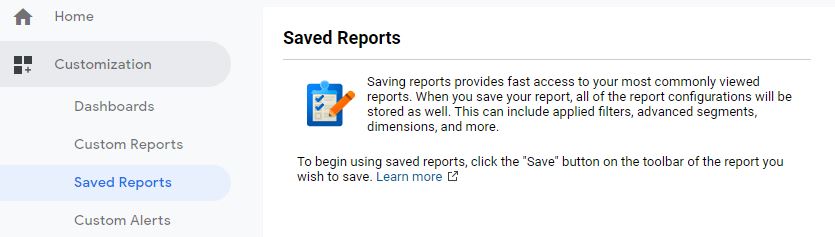
Saved Reports Tab
In this section, your settings are remembered. This way, you don’t have to reconfigure a Google Analytics report every time you open it. All of the report customizations and settings are automatically saved, with the exception of the date range, under this tab. This option will give you quick access to the reports that you use most often. This will come in handy, especially if you’re juggling multiple websites across one account or have multiple hands on the same account information. This not only saves time but also saves all the changes that are made.
Once you add a new metric to measure, this metric will remain in the shortcut menu until you change it. Even when the account has been signed out, once someone logs back in, the information will still remain on the shortcut menu.
However, even though the new metric will remain in saved reports, the date range will change. So every time you log back into Google Analytics, you’ll want to make sure you’ve selected the correct date range so that you can be sure you’re looking at the data set you need to see.
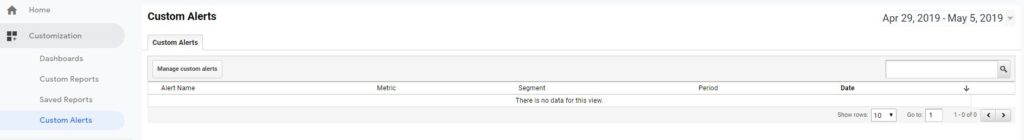
Custom Alerts Tab
Under this tab, you can set custom alerts that will only show in the current reporting view and the views that you apply the custom alert to.
Intelligence Events Tab
The Intelligence Events section shows you an overview of variations on your website. Any time a variation occurs, Google Analytics will send you an alert to let you know. When you click on “Overview” under “Intelligence Events,” you’ll see two tabs: Automatic Alerts and Custom Alerts. Under the Automatic Alerts tab, you’ll see the changes that Google Analytics detected in your website statistics regarding traffic. While under the Custom Alerts tab, you’ll get alerts only when your website traffic reaches a previously specified threshold. On this tab, you’re able to look at your daily, weekly, and monthly events.
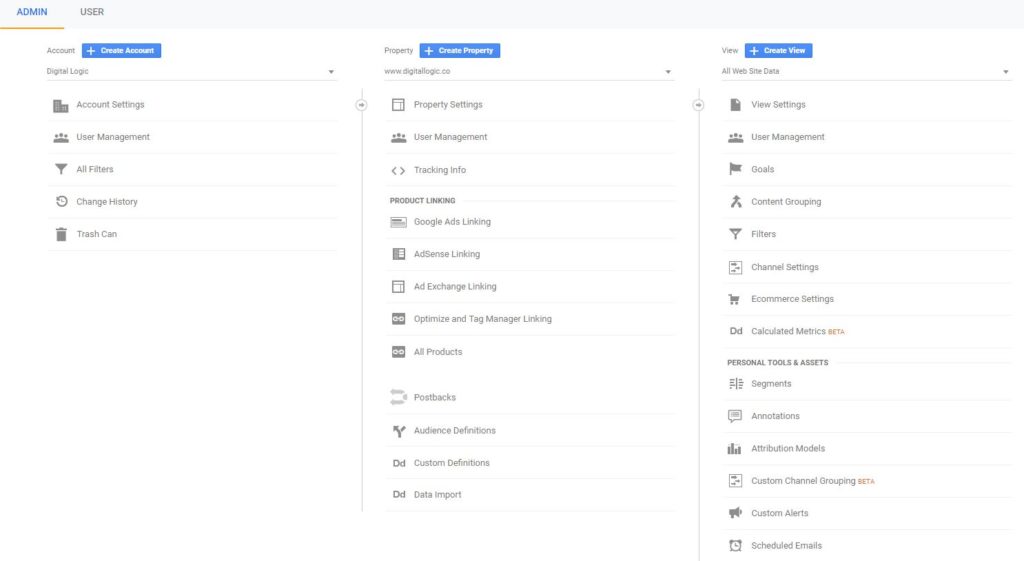
Google Analytics Admin Tab
This tab is where you’re able to manage your account and switch between various accounts if you have more than one. Think of this tab as your home base for Google Analytics. This is also where you’ll choose which website, if you have more than one, that you want to view. In this tab, you’re able to set goals. Also, this is where you will link your Google AdWords, and Google AdSense accounts to measure your campaign’s performance. Here, you can also create user segments, set up your alerts, specify your attribution models, and set up scheduled emails.
Google Analytics Reports Tab
Website owners that only have one website under your account, then Google Analytics will take you directly to the Audience Overview report once you’ve selected the Reports tab. If you have more than one website under your account, Google Analytics will take you directly to the Property column under the Admin tab. This gives you the option to select which website you’re working with at the moment. Once you’ve selected the website you want to view, you’ll then be directed to the Audience Overview report.
Either way, the Reports tab provides you with the dashboard and reporting data that best suits your needs in order to give you an insight into how your website is performing. This helps you know where and what needs to be changed for better optimization. If needed, you can also export data from Google Analytics in order to analyze it in other programs like Google Sheets.
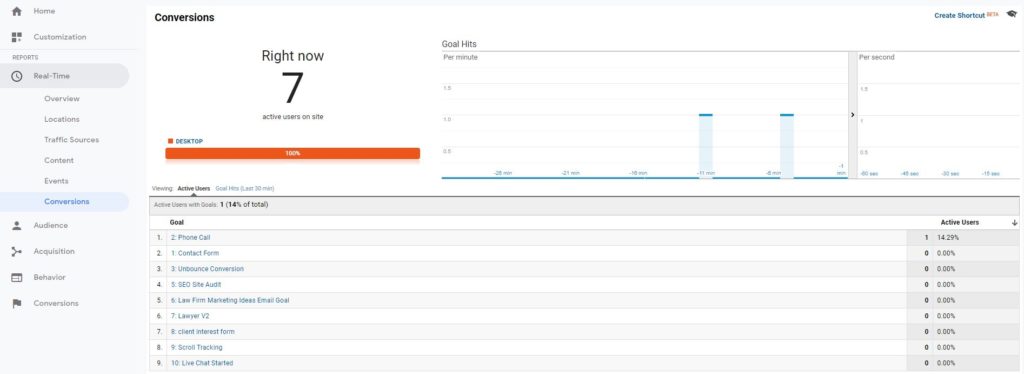
Real-Time Reports Section
The Real-Time Reports section provides you with some of the most valuable information about your website. This includes users who are currently on your website. Just like the name suggests, you get these reports in real-time. You’re able to see how many active users are on your website, how many pages of your site are being viewed per minute, some of the top keywords being used, as well as your top active pages.
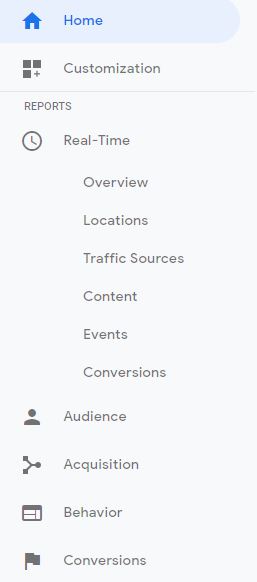
Under the Real-Time Reports tab, you’ll see several options, which include: overview, locations, traffic sources, content, events, and conversions.
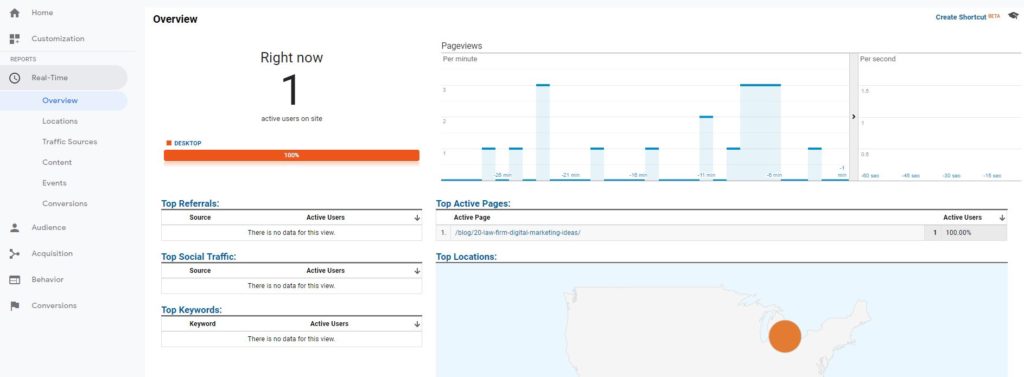
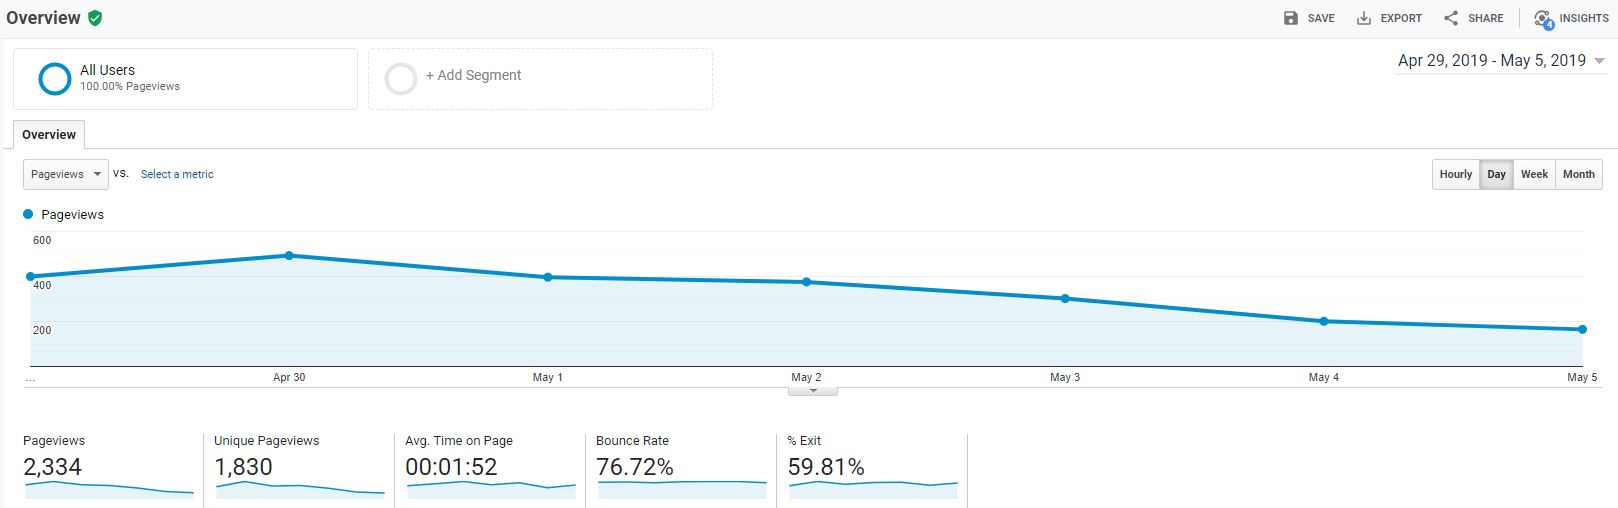
Google Analytics Overview
This basically gives you an overall monitoring experience. This report is updated constantly, and each website hit is recorded within a second after it occurs.
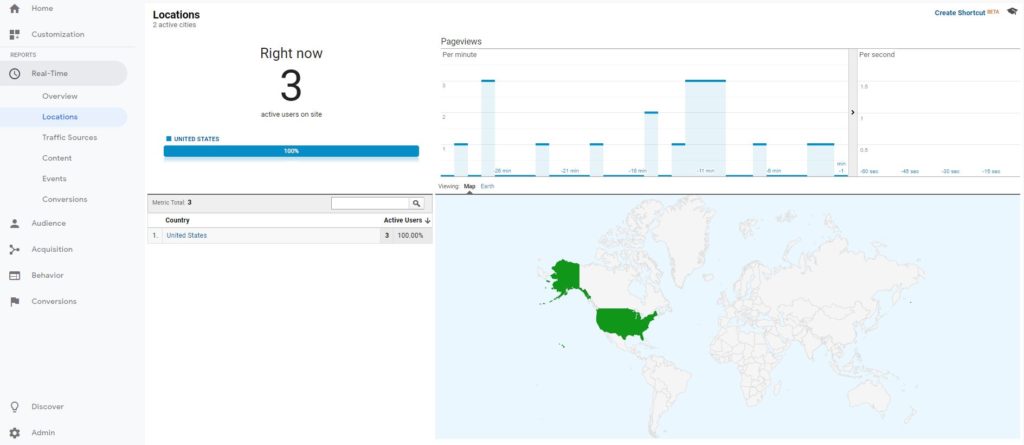
Google Analytics Locations Tab
This tab gives you a visual representation of where in the world your active webpage views are coming from. This is updated within a second, as well.
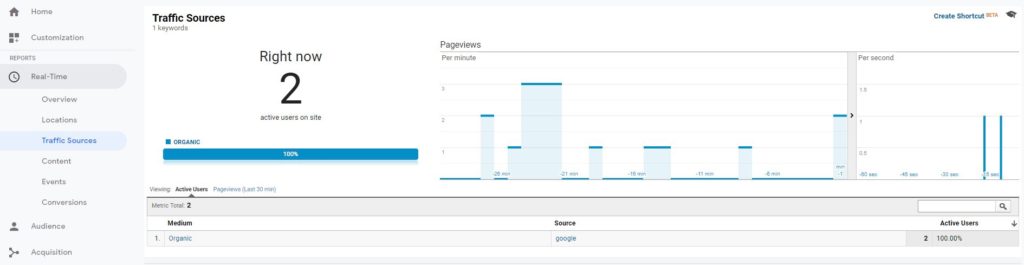
Traffic Sources Tab
Your website’s traffic will more than likely come from a variety of sources. Google Analytics breaks this down into several basic categories: organic traffic, referral traffic, social traffic, paid search, email traffic, and direct traffic.
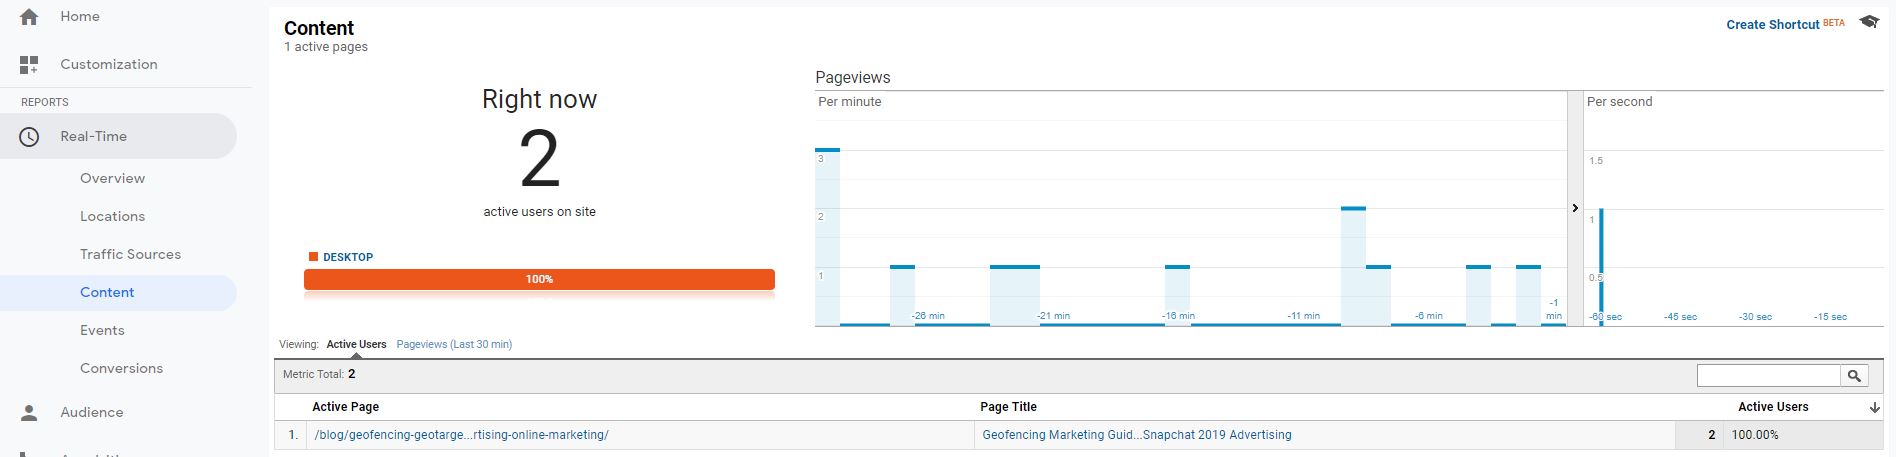
Google Analytics Content Section
In this section, you’ll see information in four different parts: pages for detailed interaction on all your pages. Content drill down- which is the data broken down by subfolder. Landing pages- where your visitors entered your website, and exit pages- the final page that your visitor was on before he or she left your site.
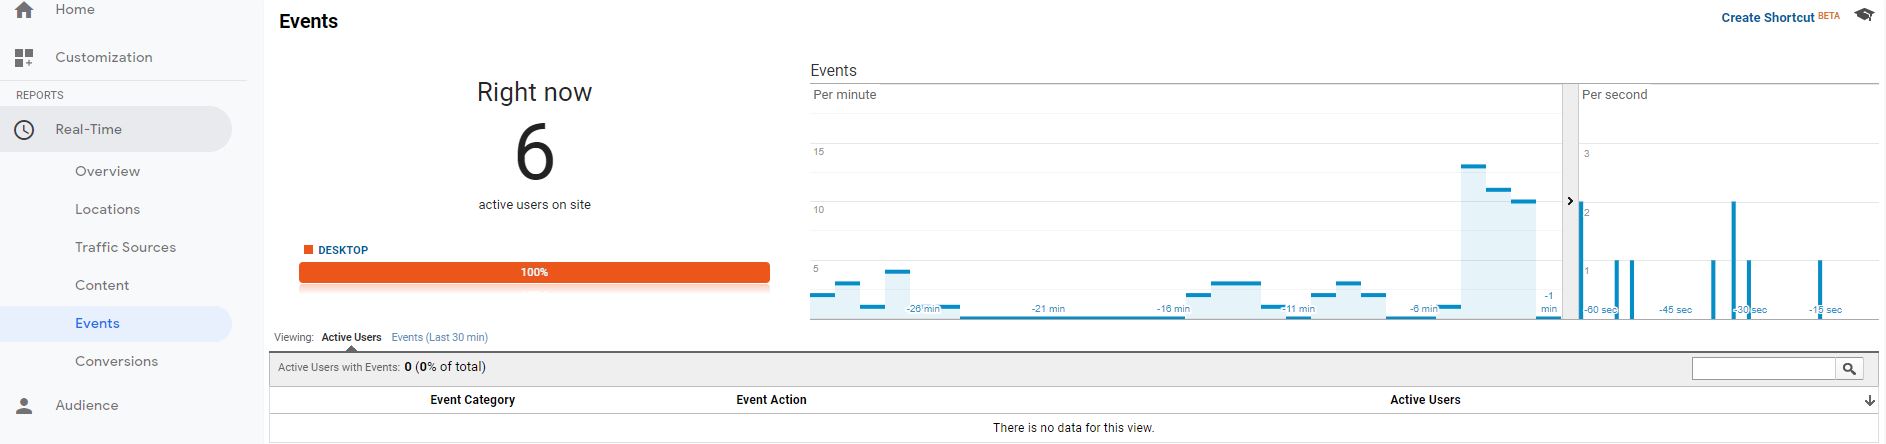
Custom Events Tab
This section allows you to create custom events for interactions on your website. A few of these may include button clicks, downloads, interaction with a chatbot, ad clicks, etc. You can toggle between those events that are happening currently and those that have occurred within the last 30 minutes.
Conversion Event Tab
This shows which goals your active users are actually completing. It also shows the total percentage of active users who have completed a goal. This is useful for testing conversions and goal configurations.
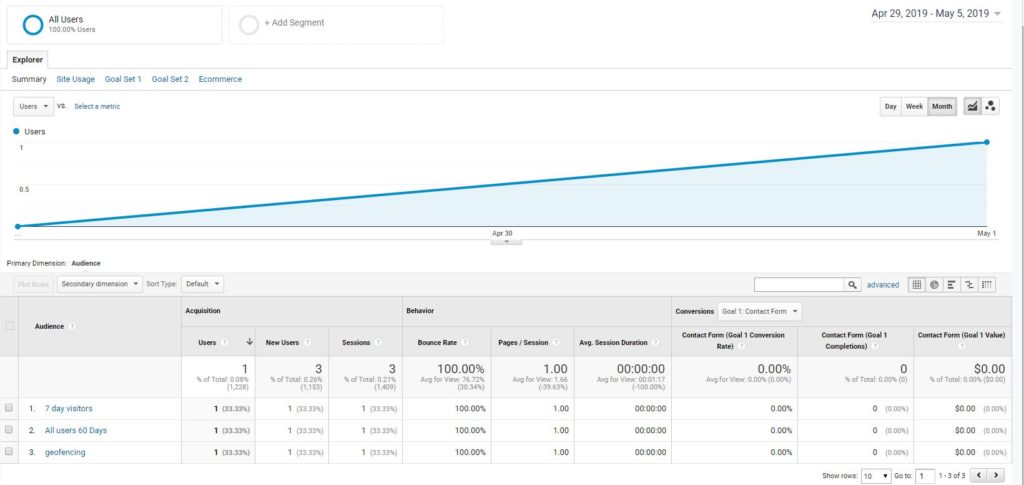
Audience Reports
The Audience Reports section does exactly what the name suggests. It provides you with information about your website’s audience.
Under the audience reports section, you’ll see a ton of different options to choose from, including an overview, active users, lifetime value, cohort analysis, audiences, user explorer, demographics, interests, geo, behavior, technology, mobile, cross-device, custom, benchmarking, and users flow.
Audience Overview Tab
This shows your current website’s audience at a glance. This is a useful snapshot of which metrics are on your side.
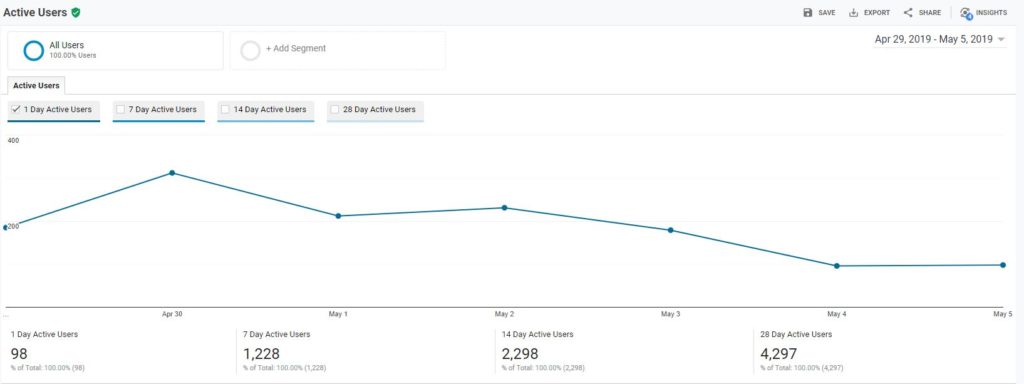
Active Users Tab
Here you can track the active users in increments of one day, one week, two weeks, or one month.
Lifetime Value Tab
The lifetime value tab lets you understand how valuable different users are to your business based on multiple sessions on your website.
Cohort Analysis Tab
This is a group of users who share a common characteristic that is identified by this report. This lets you isolate and analyze specific behaviors.
Custom Audiences Tab
You can create custom audiences and publish them to analytics. You may also use this as a secondary dimension.
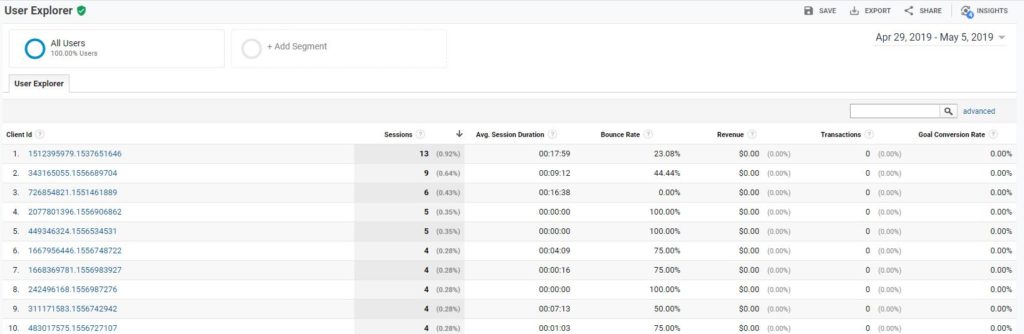
User Explorer Tab
Here, you can isolate and examine the individual rather than the aggregate user behavior. This is associated with either a client ID or a user ID.
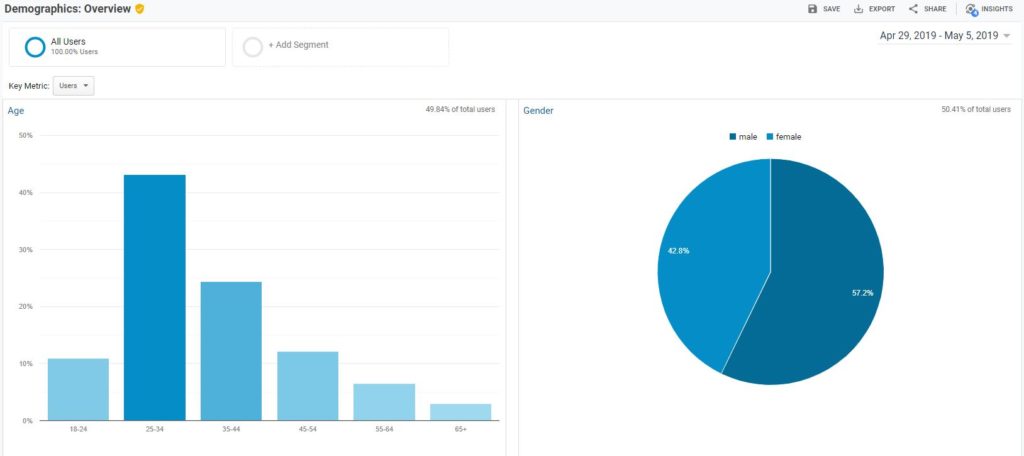
Demographics Tab
The demographics tab allows you to view data in three different ways: overview, age, and gender.
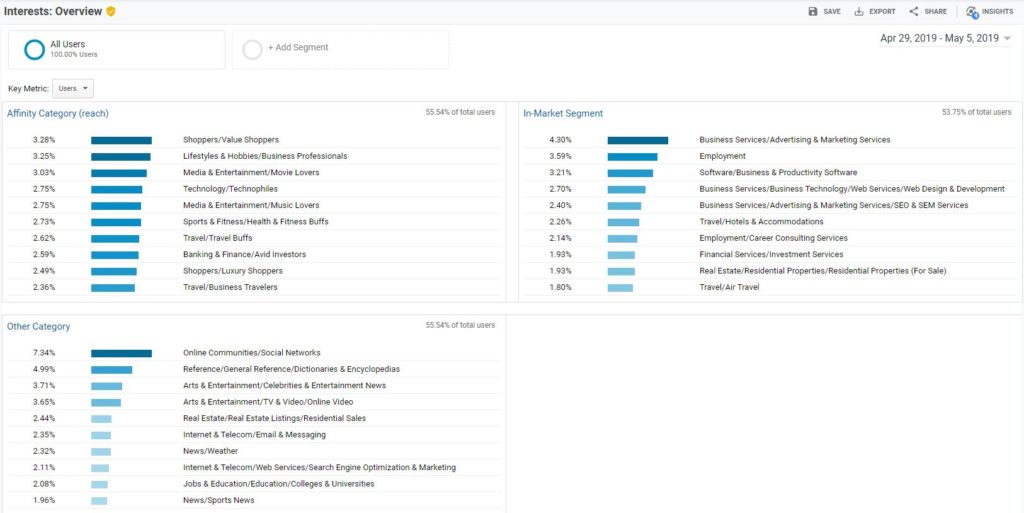
Interests Tab
This tab shows you what the interests of your website visitors are. The Interests tab is broken down into overview, affinity categories, in-market segments, and other categories.
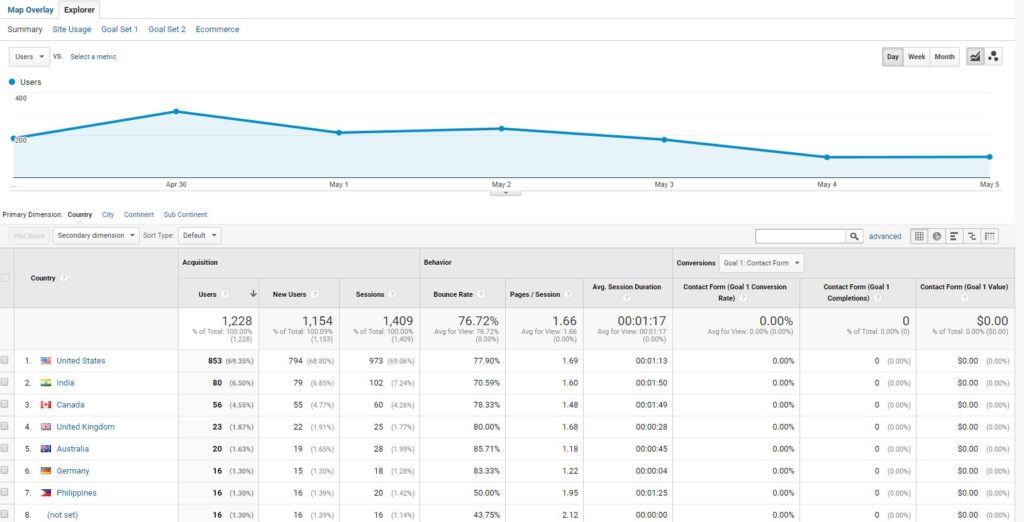
Geographical Locations
The Geo tab shows you the locations of your audience and the languages they speak.
User Behavior Tab
The user behavior tab shows the behavior of your audience when it comes to your website. This includes whether or not they’re a first-time user, how often and how recently they have visited your site, the level of engagement while on your website, and what actions they took on the website, whether or not the ID associated with that user has been assigned.
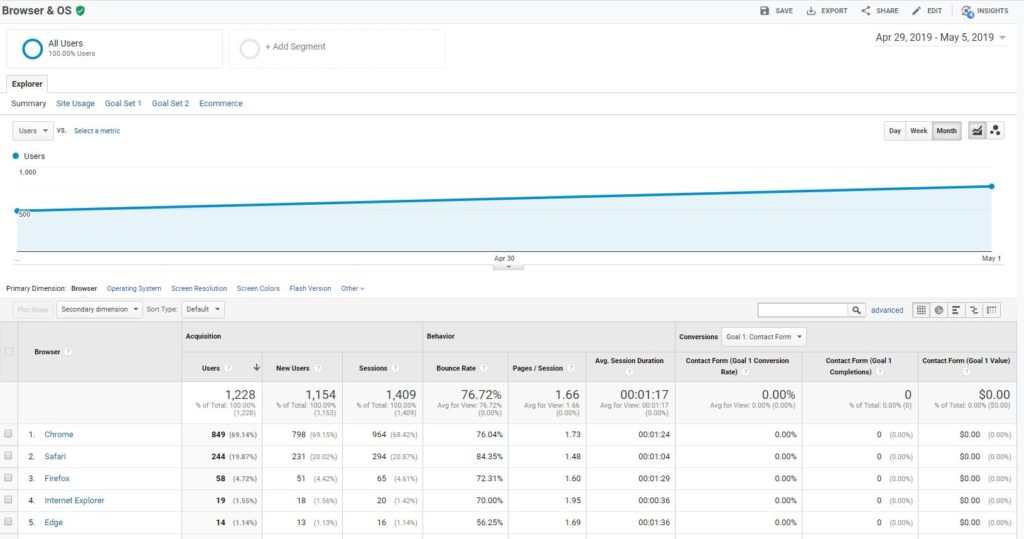
Technology Tab
Understanding the technologies that users employ to consume your data will allow you to fine-tune your content and plan more effectively. This section is broken down into two parts: Browser/OS and Network.
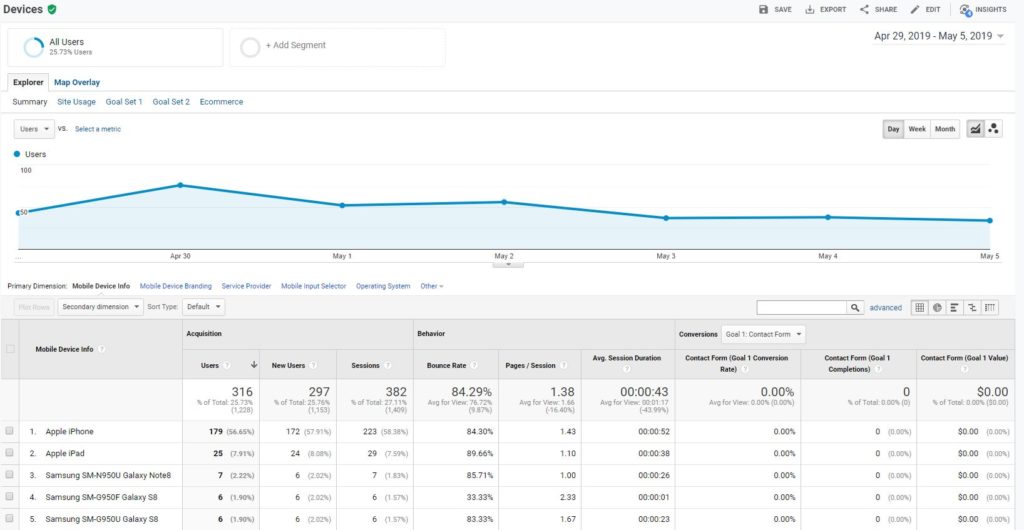
Mobile Apps Tab
See which mobile devices are being used to view your website using the mobile tab.
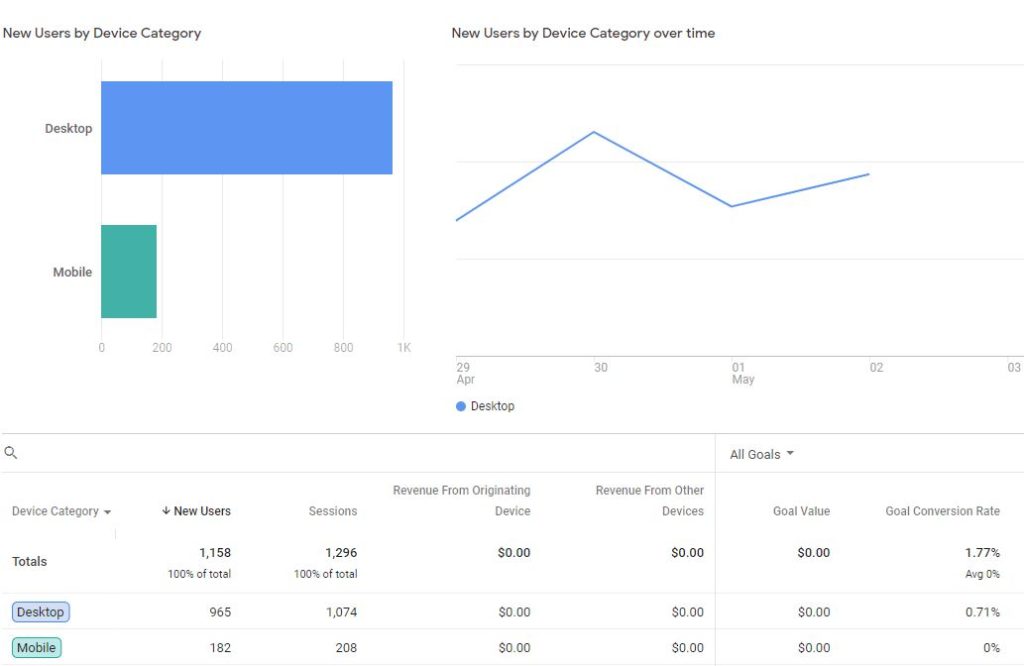
Device Categories
The Cross-Device Tab gives you the tools you need to analyze data over multiple device categories in one cohesive analysis, and this allows you to get a better idea of how touchpoints that may not seem to relate are actually connected. It is divided into four different parts: device overlap, device paths, channels, and acquisition device.
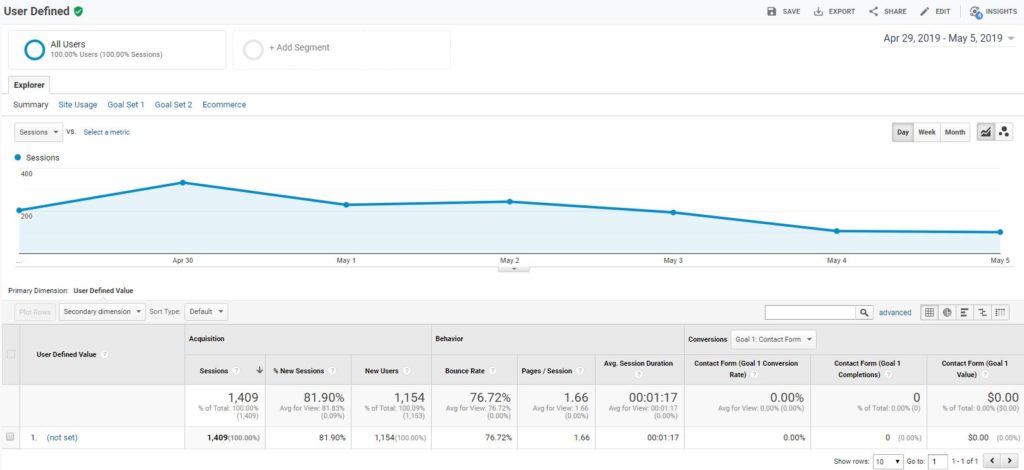
Custom Parameters
You may use custom variables to extend the scope of your already implemented segments. For instance, you can view certain behaviors in a set period of time. The custom parameters tab gives you two ways to view your data: custom variables or user-defined.
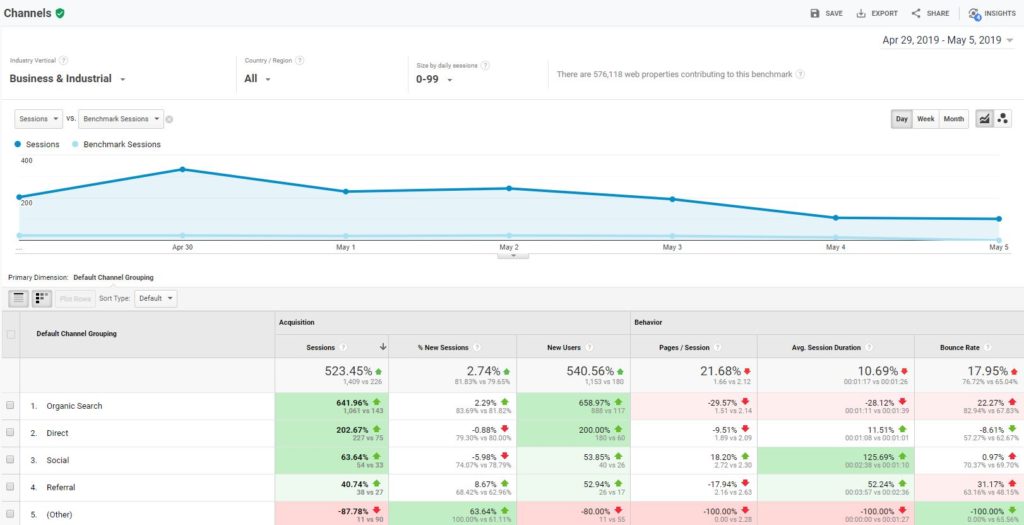
Benchmark Tab
This allows you to compare the date with your competition. You’ll need to gain insight into industry trends in order to target your audience better. You can only use benchmarking to compare data only with companies that choose to share their data. If you choose this tab, you may choose from three different reports: Channels, Location, and Devices.
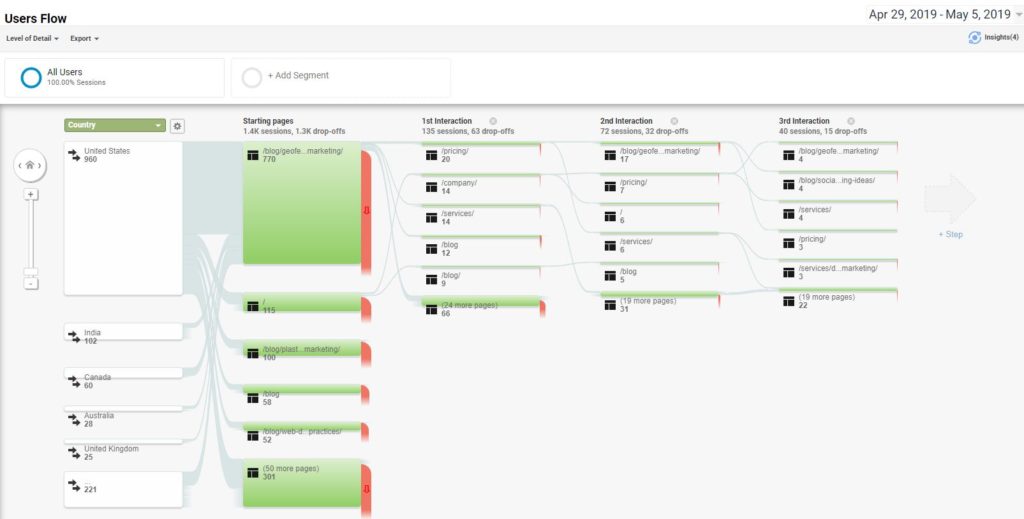
Users Flow Tab
The Users Flow tab gives you a graph of your audience’s journey through your site. This means what page they landed on, which pages they viewed, and at what point they left your site.
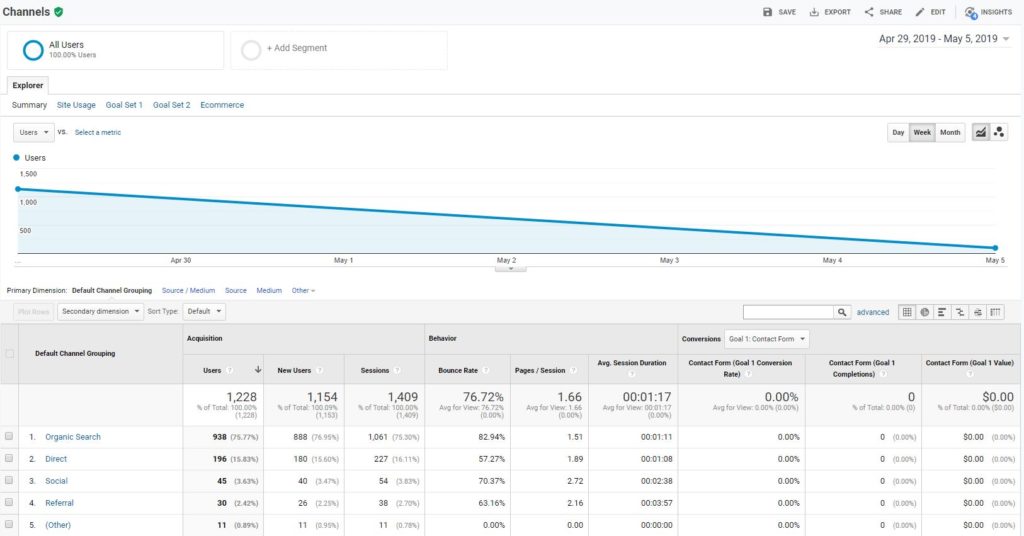
Acquisition Reports
The Acquisition Reports tab shows you how your website visitors actually came to your website. This shows you the overview of your direct, organic, referral, social, and email traffic. If you use Google AdWords, you’ll also be able to see how your PPC (pay-per-click) campaigns are performing. To do this, you’ll go to the Admin tab and link your Google AdWords account with your Google Analytics account.
Under the Acquisition Reports tab, you’ll see a Search Engine Optimization tab. This report shows you which keywords your audience searched for on search engines that led them to your page. For example, we get a lot of users who found us by searching “digital marketing companies.”
In order to use this feature, you’ll need to have a Google Webmaster account and link it to your Google Analytics account.
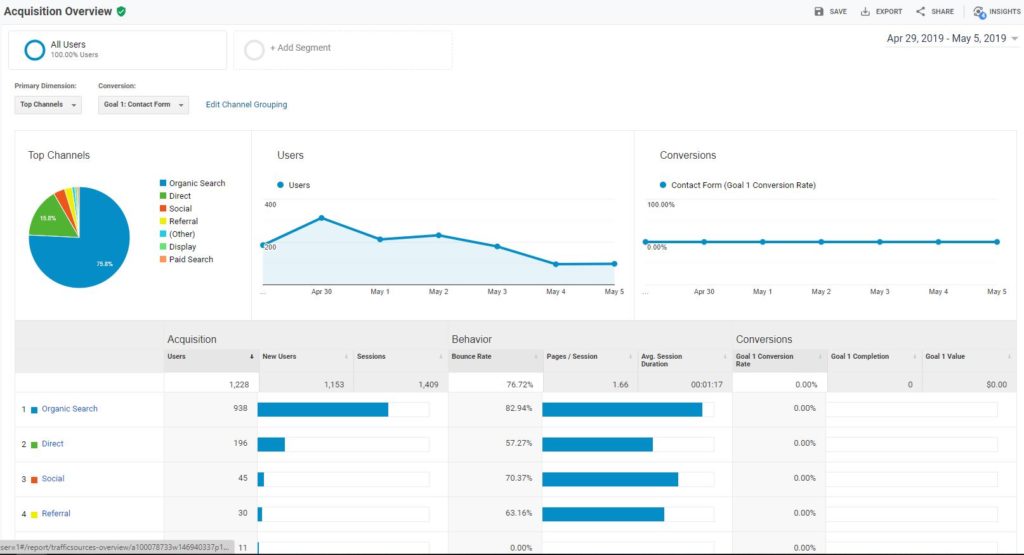
Overview Tab
This provides a snapshot of what Google calls the “Acquisition-Behavior-Conversion Cycle,” otherwise known as the ABC cycle. The overview shows where users come from, what they do on your website while they’re there, and if they complete a conversion.
All Traffic Sources
If you want to know which websites send you the most traffic, this is where you’ll find that data. By default, you will be shown the biggest traffic sources. This section is broken down by channels, treemaps, source/medium, and referrals.
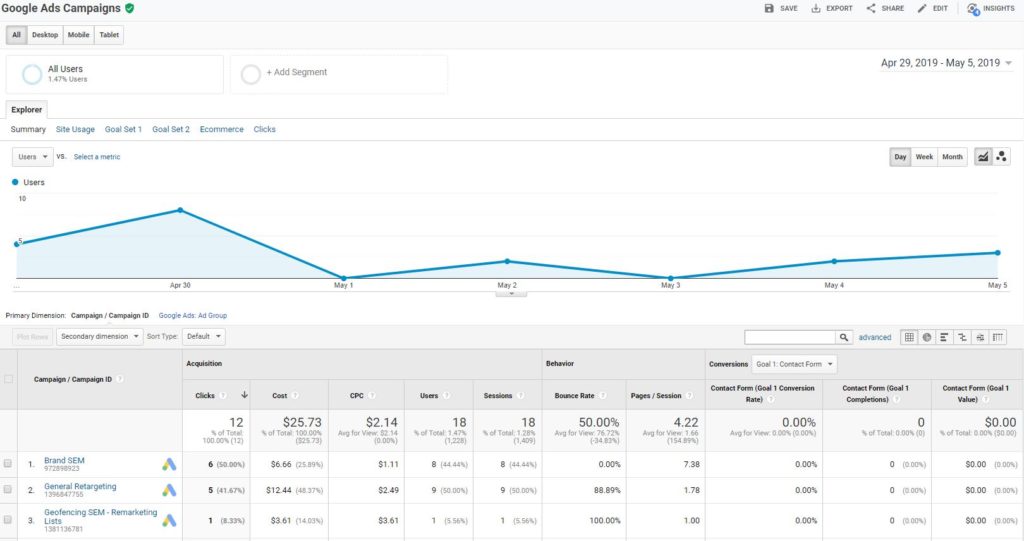
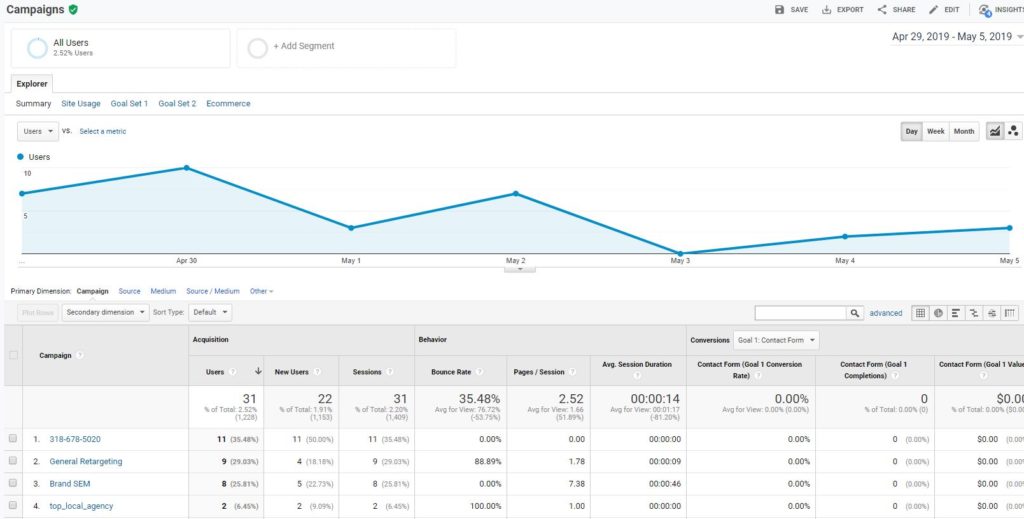
Google Ads Campaigns Tab
Linking a Google Analytics property to your Google Ads account can help you analyze activity on your website after an ad click or impression. You will have to have administrative access to the Google Ads account in order to do this. This section is broken down into smaller categories that include: campaigns, treemaps, site links, bid adjustments, keywords, search queries, hour of day, final URLs, digital display ad targeting, video campaigns, and shopping campaigns.
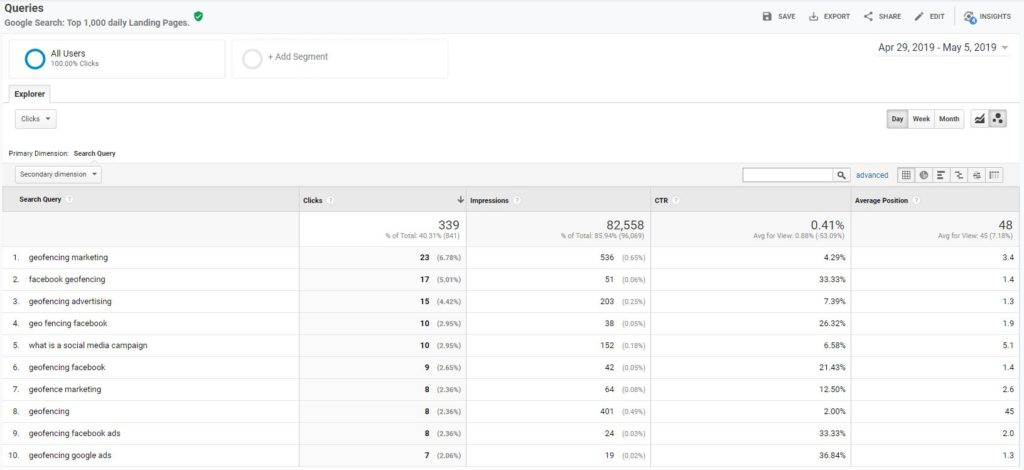
Google Search Console Section
The Google Search Console section provides information about the performance of your organic search traffic. You can see data such as queries, what devices your audience is using, what country your audience is searching from, and what landing pages they visited first.
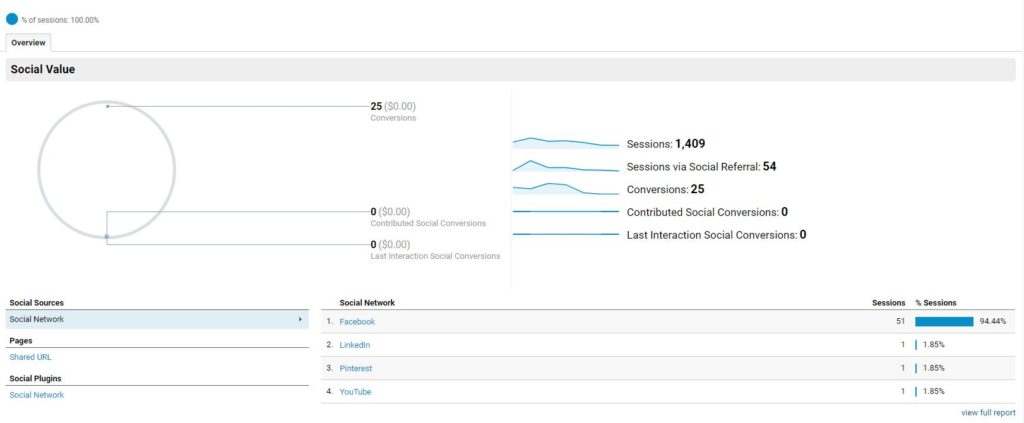
Social Tab
This tab basically brings you your social value. It is broken down into conversions-which is the total number of conversions the entire site has received, not just from social media, assisted social conversions- these are the conversions that social media did help with. Last interaction social conversions- these were more than likely brought directly from a social media source. You can also view your social plugins here, as well as a flow chart for user patterns coming from social media. For this to work, you must first have at least one goal set up.
Google Ads Campaigns
This breaks your traffic down by campaign type. You can choose to view this as all campaigns combined or separately by paid keywords, organic keywords, or using the cost analysis tool.
Behavior Reports
The Behavior Reports tab shows you how your website visitors are interacting with your website. This gives you the information you need to know about your content performance. You can view this via the following tabs:
User Behavior Overview
Behavior Overview shows you the pages your visitors are navigating through from the beginning until they leave your website. This provides an overall snapshot of visitors’ behavior on your website.
Experiments
Experiments allow you to conduct tests to see which of your landing pages performs the best or is able to convert the most traffic. You will do this using Google Optimize.
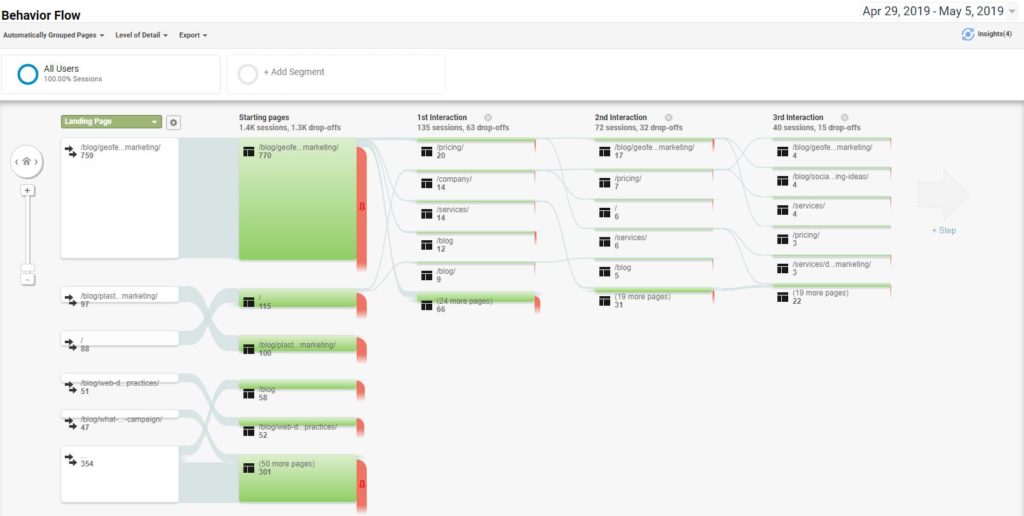
Behavior Flow
Behavior flow gives you the visualization of the path that the user follows from one page to the next. This can either be a single page view or several. This will help you identify your most engaging content, to your visitors, on your website.
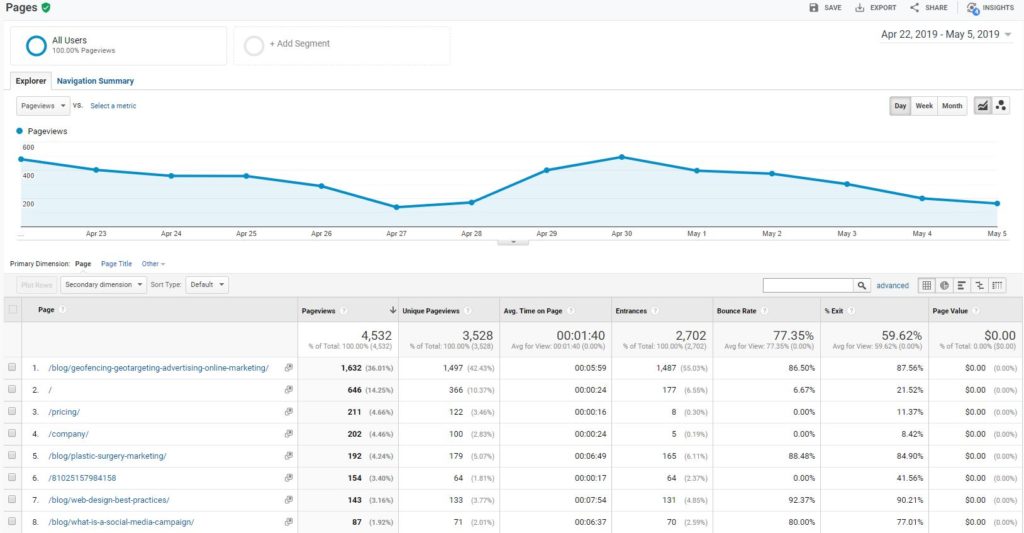
Site Content
Site Content shows the content on your website that is performing the best. The site content is broken down into all pages, content drill-down, landing pages, and exit pages.
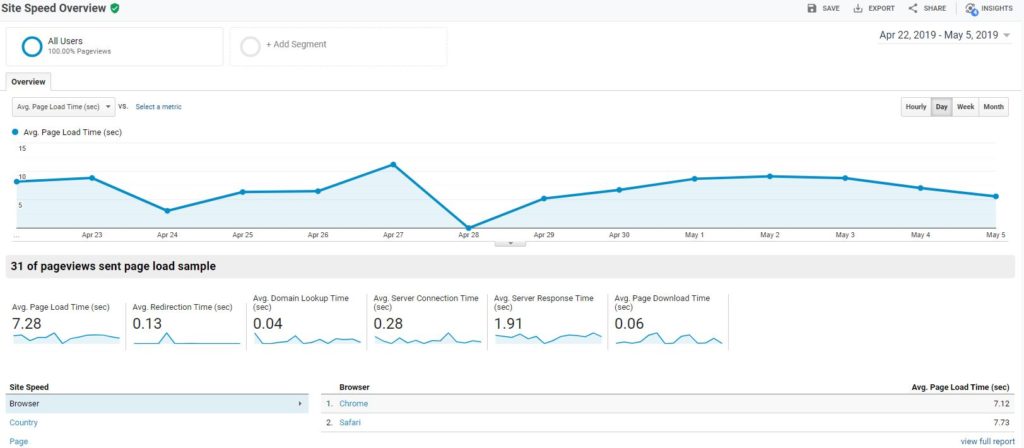
Site Speed Overview
Site Speed shows you how fast your website actually is. It also shows what pages are slowing your site down, as well as a few pointers on how you can speed your website up. You can choose to view this via overview, page timings, user timings, or get speed suggestions. This section will tell you which pages, if any, are the ones causing problems.
Site Search
Site Search shows you the keywords that are being used on your actual site. You’ll need to set up a site search in order to access this data, obviously. You can view your search information via overview, usage, search terms, or search pages.
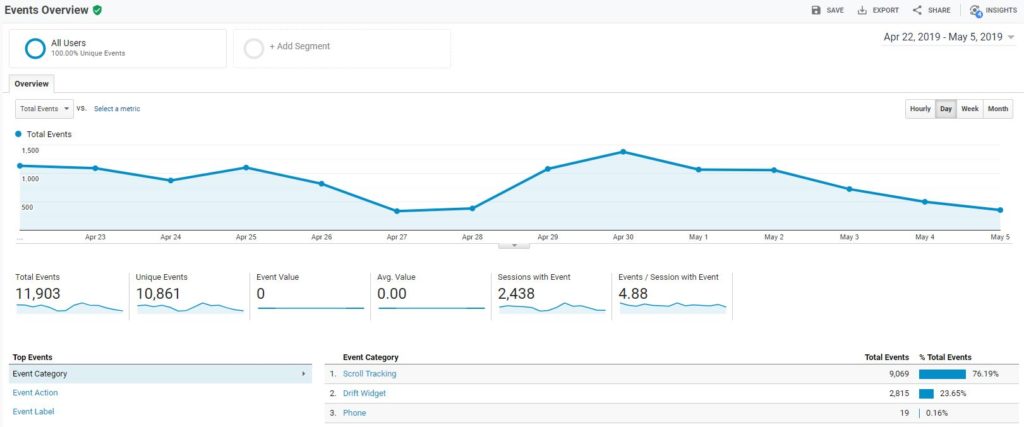
Events
Events allow you to track specific automatically tracked events or actions of your website visitors. Automatically tracked events can include actions such as signing up for an email list, purchasing an ebook, or clicking on a specific link.
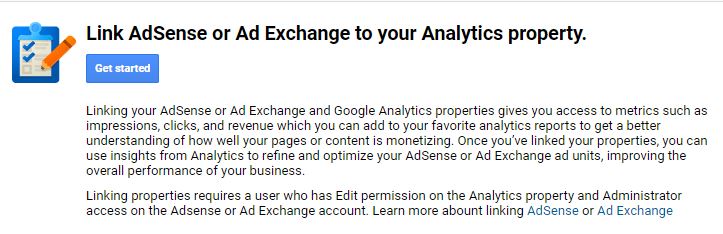
Publisher
In order to use this, you’ll need to have an AdSense account and have it linked to your Google Analytics account. If you do, you’ll be able to see your publisher data in the Publisher Reports tab.
Conversions Reports
The Conversions Reports tab will show you the actions your website visitors, who were converted, took before converting. The reports in this section will show you the entire path that led to the conversion.
You have four different reports within the Conversions Tab:
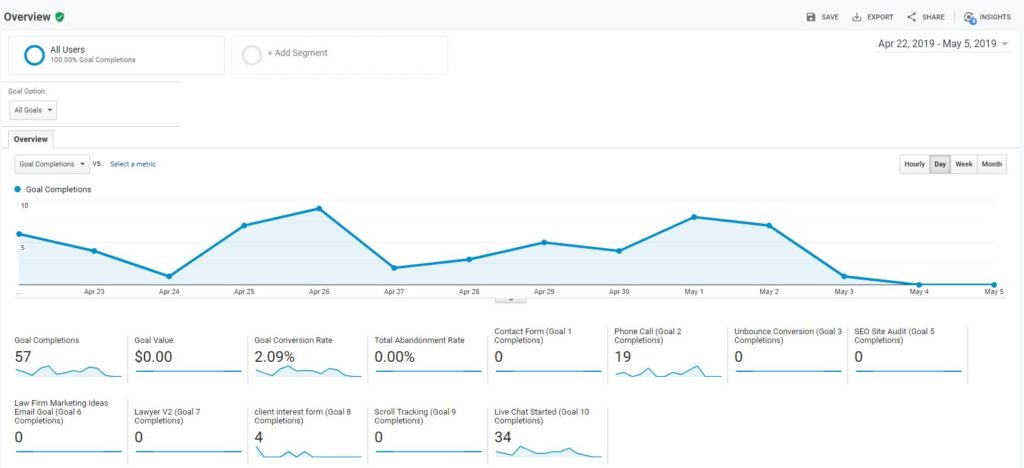
Conversion Goals
Goals allow you to create and track conversions. This tab also allows you to create and track goals that lead to these conversions.
You can view this by overview, goal URLs, reverse goal paths, funnel visualization, or goal flow.
E-commerce
E-commerce gives you some insight into the activity of your customers. E-commerce tracking is really only helpful for e-commerce websites, though.
For e-commerce sites wanting to use this feature to track a conversion event, you can view your information through an overview, product performance, sales performance, transactions, and time to purchase.
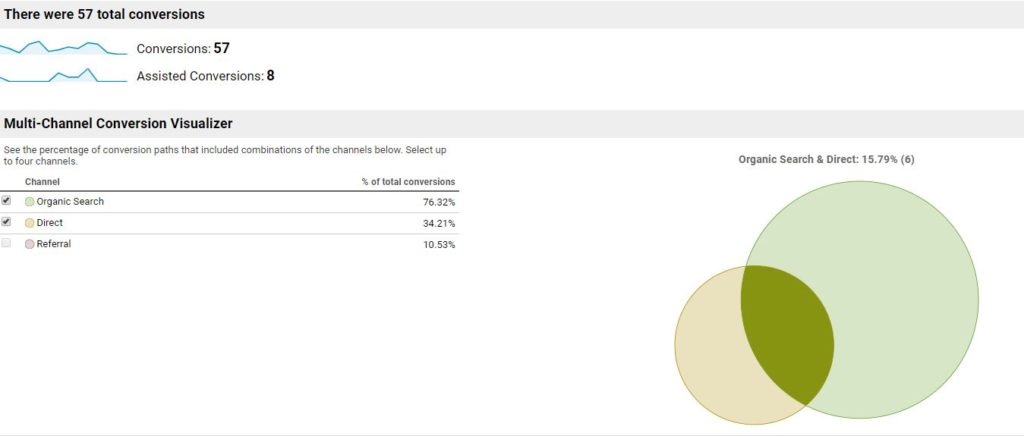
Multi-Channel Funnels
Multi-Channel Funnels show you how all of your marketing channels are performing with respect to a conversion event. This is broken down into assisted conversions, top conversion paths, time lag, and path length.
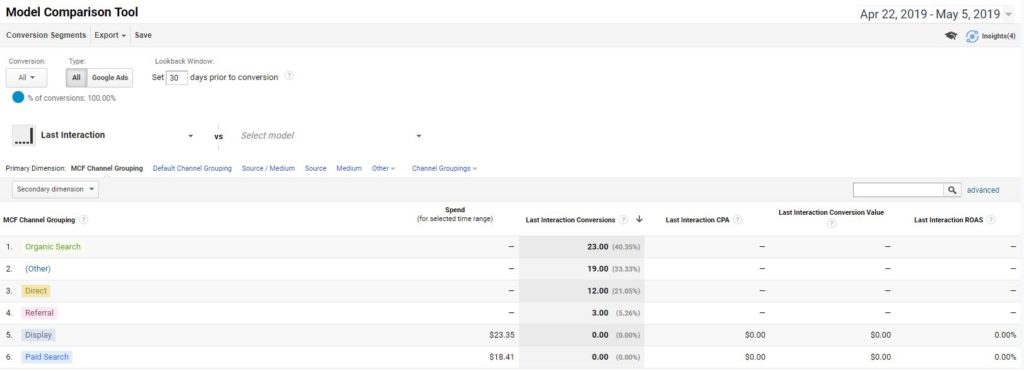
Attribution
Attribution lets you assign specific credits for conversions to specific points on the journey.
Learn more about multi channel attribution modeling
Google Analytics Metrics
Although we’ve already mentioned several of these throughout the blog, we felt it would be easier to understand in a condensed format in order to understand your Google Analytics reports:
Sessions
Sessions show you the number of interactions on your website during the specified time period. One session can include several page views, events, and transactions. One session duration is, by default, 30 minutes. You can change your session duration manually, as well.
Users
Users shows you the number of users who visited your website during the specified time frame.
Pageviews
Pageviews shows you the number of views for your website, but it only shows the ones that Google Analytics is tracking. This takes into account page reloading and page returning, too.
Pages/Session
Pages/Session shows you the average number of visited pages during one session. For instance, if a user visits five pages during one session, and another user visits 4 pages during a single session, your metric will read: 4.5 [ (4+5) / 2 = 4.5 ]
Average Session Duration
This method is calculated by subtracting the duration of the last engagement on your website from the duration of the first engagement. This does not include time spent on exit pages.
Bounce Rate
Bounce Rate shows you the percentage of visitors that “bounced” from your website. This means that they immediately left your site without clicking on anything else.
Percentage of New Sessions
Percentage of New Sessions shows the percentage of new sessions that have taken place on your site.
Goal Conversion Rate
Goal Conversion Rate is the measurement of the conversion rate of each goal set for your site and then added up. This is not an average. This is a sum. Keep that in mind when viewing your reports.
For a more comprehensive post on metrics, check out our blog post: Top Key Digital Marketing Metrics.
Work With Google Ads Professionals
If you’re running a website for your business, the fact of the matter is that you really need Google Analytics in order to have any sort of idea of how your website is performing. Google Analytics provides you with the information you need in order to better manage your website. Because of this, you’ll be able to reach your goals more quickly, and you’ll make sure that all of your marketing efforts lead to more conversions.
We hope that this guide will give you all the information you need to set up your own Google Analytics account.
Digital Logic offers PPC campaign management services and local ad services to help grow your business more quickly.